

A standard investment statement template has one assumption baked into it at a level most people never think to question: that every position has a current market value, as of the statement date, that can go in a "Value" column. That assumption holds for public equities, bonds, and funds with daily NAV. It does not hold for a private equity commitment, a private credit position, or a real estate fund interest - and building a template around it produces a document that either misrepresents what the client actually holds, or simply cannot display the position at all.
This isn't a formatting inconvenience. It's a structural mismatch between what a liquid-asset template is built to show and what an illiquid position actually is. Getting it right requires understanding why the data itself is shaped differently, not just finding a way to squeeze a new number into an existing column.
Why the Liquid-Asset Data Model Doesn't Transfer
A liquid holding has a market value because it trades. Someone, somewhere, transacted at a price close to now, and that price is the value. The statement's job is to retrieve that value as of the statement date and display it - a single number, one column, done.
A private equity or private credit position does not have that property, for two structural reasons.
There is no current market price. An investor's stake in a private fund is valued periodically by the fund's general partner or administrator, not continuously by a market. Between valuation events, there is no updated price to retrieve - the last valuation is the only figure that exists, and it stays the figure until the next valuation cycle produces a new one.
The relevant figures are about commitment and cash flow, not a single value. When an investor commits to a private fund, they aren't buying a position at a price. They're committing capital that gets called over time, as the fund identifies investments to make. What the investor needs to see is not "current value" but a small set of related figures that together describe where the commitment stands: how much was committed in total, how much of that commitment has actually been called (drawn) so far, how much remains uncalled, how much has been distributed back, and what the fund administrator's most recent valuation of the remaining position is.
These aren't optional enhancements to a value column. They're a genuinely different data model - one built around a commitment lifecycle, not a tradable position - and a template built for the second model cannot correctly represent the first without either dropping information or fabricating a "value" that doesn't mean what the reader thinks it means.
The Data Model a Capital Account Statement Actually Needs
Where a liquid holding needs one figure, a capital account position needs at least five, each answering a distinct question:
- Committed capital - the total amount the investor agreed to commit to the fund.
- Unfunded commitment - how much of that commitment has not yet been called.
- Called-to-date - the cumulative amount actually drawn from the investor so far.
- Distributed-to-date - the cumulative amount returned to the investor, whether as a return of capital or a gain.
- Current NAV - the fund administrator's most recent estimate of what the remaining position is worth.
A statement that collapses these into a single "value" figure - say, called-to-date minus distributed, or current NAV alone - answers a different question than the one the investor actually has, which is usually some version of "where does my commitment stand, and how has it performed so far." Presenting the full set, clearly labelled, is what lets the reader actually answer that question rather than a simplified stand-in for it.
Fund administrators and portfolio accounting systems that manage private fund positions already track these figures as distinct fields - this is not new data your reporting layer needs to derive. For the event-triggered notices that create the called and distributed figures, see Capital Calls and Distribution Notices. The design requirement is presenting them correctly and completely on the statement, not calculating them from something simpler.
The Real-World Case Is a Mixed Portfolio
Almost no client holds only illiquid assets. A wealth management or family office client typically holds a mix - public equities and bonds alongside a private equity commitment or two, or an asset manager's institutional client holds a diversified allocation that includes an illiquid sleeve alongside liquid holdings.
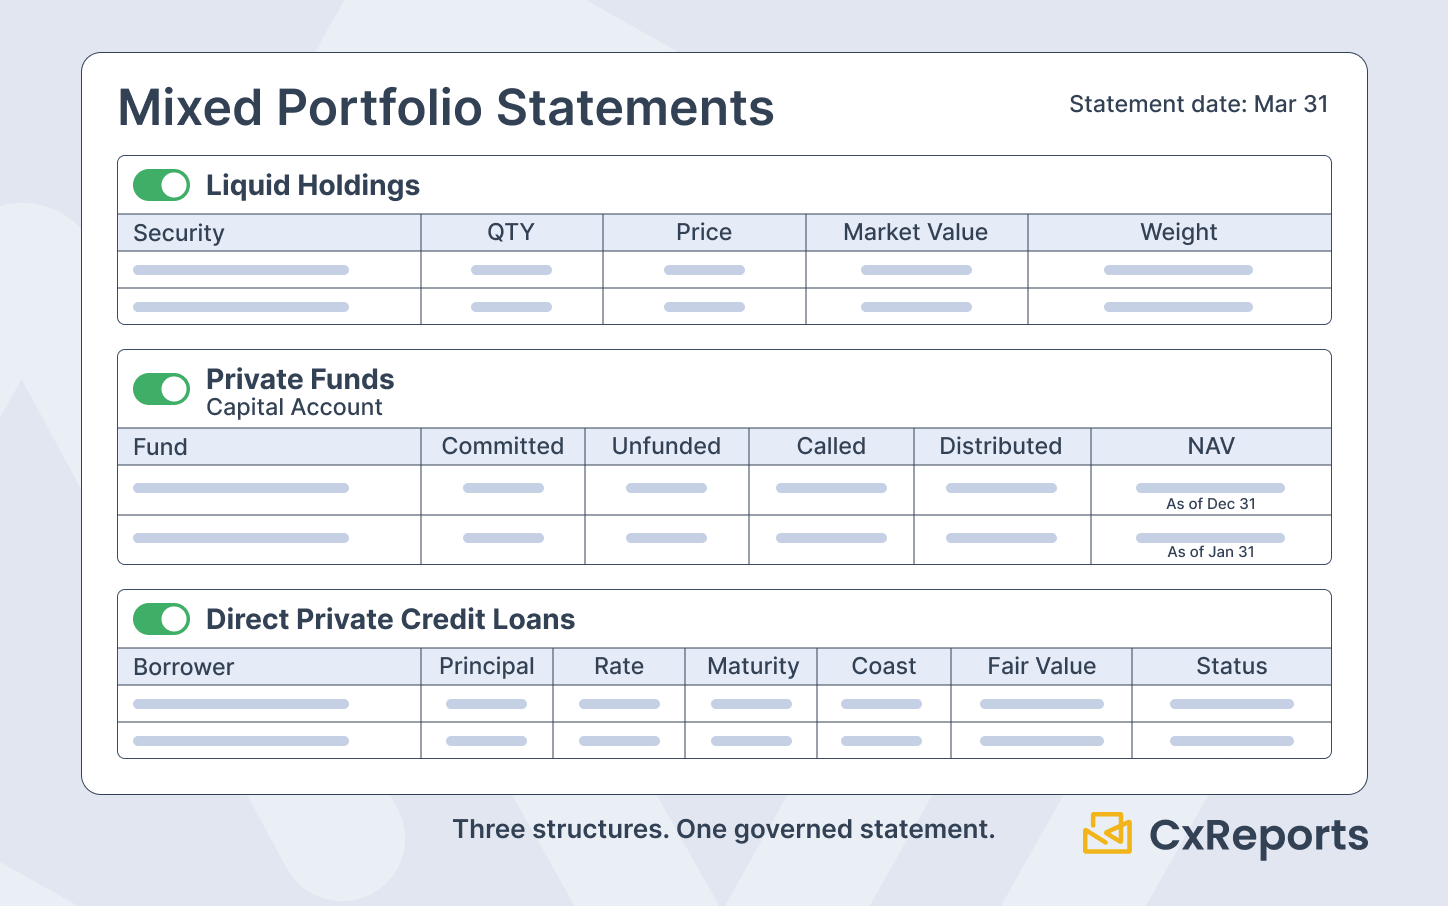
This is where the structural mismatch becomes an actual design problem rather than a theoretical one. The statement needs to present the liquid holdings in the format that makes sense for them - a table with quantity, price, market value, weight - and the illiquid holdings in the format that makes sense for them - committed, called, distributed, current NAV - on the same document, for the same client, without forcing either into the other's structure.
Trying to force a single table format to cover both produces one of two bad outcomes: either the illiquid rows have several columns that are blank or meaningless (price, quantity), or the liquid rows have columns that don't apply to them (committed capital, unfunded commitment). Neither is acceptable in a client-facing document. The correct approach is two structurally distinct sections - a liquid holdings table and an illiquid capital account table - that appear together on the same statement, each internally consistent, neither compromised by the other's requirements.
The Valuation-Lag Disclosure Problem
Because private fund valuations are updated periodically rather than continuously, a capital account statement is almost always presenting a NAV figure that is not as of the statement date - it's as of the fund's last valuation cycle, which in many cases is a full quarter behind.
This is not a data problem. The NAV figure your fund administration system provides is correct for the period it covers. It's a labelling and layout problem: the statement has to make it unmistakably clear to the reader that this specific figure is dated differently from the rest of the document, so a client doesn't reasonably assume their private equity NAV is "as current" as their brokerage account balance sitting right above it on the same page.
The practical requirement is a visible "as of" label attached specifically to the lagged figure - not a general disclaimer buried in a footnote, but a label placed directly next to or beneath the NAV figure it applies to, sourced from the actual valuation date your fund administration system provides for that position, not a static assumption about how far behind the figure typically runs. Different funds within the same portfolio can have different valuation dates; the label needs to reflect the specific date for that specific position, not one blanket date for the whole illiquid section.
How Conditional Structure Handles the Mixed-Portfolio Case
The mechanism that makes a single statement template work across clients with different portfolio compositions - some entirely liquid, some mixed, some predominantly illiquid - is the same conditional pattern that handles any client-dependent variation on a shared template: a parameter describing what's actually present, and a section that activates or doesn't based on it.
A statement template can define the liquid holdings section and the illiquid capital account section as independent parts of the document, each tied to a condition - does this client have liquid holdings this period, does this client have illiquid fund positions this period. A client with only liquid holdings gets a statement with just that section. A client with a mixed portfolio gets both sections, in order, on the same document. A client whose sole holding is a single private equity commitment gets just the capital account section. The template doesn't change between these cases - the data determines which parts of it render.
This is a natural fit for treating the illiquid section as an independently maintained component - its own layout, its own data source, tested on its own - that gets embedded into the parent statement only when the client's holdings call for it, rather than being force-fit into the same table structure as the liquid section or duplicated across separate near-identical templates for "liquid-only," "mixed," and "illiquid-only" clients.
How This Maps to CxReports
The liquid holdings table is a standard Data Table bound to the liquid positions data source - quantity, price, market value, and weight columns with standard number and currency formatting.
The capital account section is naturally suited to a Key Value Grid or a dedicated Data Table for the committed/unfunded/called/distributed/NAV fields, kept as its own component or - for portfolios where the illiquid section has enough internal structure to warrant it - its own subreport, independently designed and tested with representative fund data before being embedded in the parent statement, following the same composite-document pattern used for any statement that assembles independently-scoped sections.
Whether each section appears is controlled through a report parameter - a Lookup value describing whether the client's portfolio for this period includes liquid holdings, illiquid holdings, or both (or two Switch parameters, one per holding type) - read by the parent statement's data query and referenced in each section's component-level Visible Expression. The liquid table and the capital account section each render only when the corresponding parameter condition is met, so one template correctly serves clients across the full range of portfolio compositions without needing a separate template per combination.
The valuation-lag label is a Text component bound directly to the "as of" date field your fund administration system provides for that specific fund position - formatted with a standard date suffix - placed immediately adjacent to the NAV figure it qualifies. Because it's bound to the actual per-fund valuation date rather than a fixed assumption, a portfolio holding two private funds with different valuation cycles shows the correct, distinct date next to each one.
What CxReports does not do: it does not calculate committed capital, called amounts, distributions, or NAV - those figures, along with the valuation date each NAV applies to, come from your fund administration or portfolio accounting system as data source fields. CxReports does not determine when a valuation is "too old" to disclose, either - that threshold, if your organisation applies one, is a business rule your data layer or your operations process enforces before the figure reaches the template. CxReports renders the figures and the labels it's given, precisely and consistently, and activates the correct sections for the portfolio composition it's told about.
Getting Started with CxReports
| Illiquid asset reporting requirement | CxReports mechanism | What stays with your systems |
|---|---|---|
| Liquid holdings table (quantity, price, value) | Data Table bound to liquid positions data source | Position data from your custodian or portfolio system |
| Capital account fields (committed, called, distributed, NAV) | Key Value Grid or Data Table, optionally as a subreport | Figures from your fund administration or portfolio accounting system |
| Mixed portfolio - both sections on one statement | Report parameter (Lookup, or two Switches) + component Visible Expression per section | Determining, per client per period, which sections apply |
| Independently designed illiquid section for complex portfolios | Subreports with own data source and parameters | Testing the section standalone with representative fund data |
| Valuation-lag "as of" disclosure per fund position | Text component bound to the fund's valuation date field, date-formatted | The actual valuation date from your fund administrator, per position |
| One template serving liquid-only, mixed, and illiquid-only clients | Conditional sections on a single shared template | Avoiding template-per-portfolio-type duplication |
For documentation on Data Tables, Key Value Grids, subreports, and report parameters, see the CxReports documentation. To discuss statement design for portfolios that combine liquid and illiquid holdings, request a demo.