Introduction
Think generating reports in MySQL is just for data experts? Think again. The truth is, that anyone can master the art of report generation in MySQL, and you don't need to be a seasoned developer to do it. In fact, the most powerful, pixel-perfect reports often come from those who know how to use the right tools and techniques, rather than relying solely on advanced coding skills.
In this post, I'm going to show you how easy it can be to create professional, accurate reports in MySQL—whether you're pulling data from a single table or generating complex financial summaries. You might be surprised at how quickly you can transform raw data into visually appealing, insightful reports that not only impress your team but also drive better business decisions.
Ready to rethink how you approach report generation in MySQL? Let's dive in and break down the process into simple, manageable steps that anyone can follow. By the end of this post, you'll see that generating high-quality reports isn't just within reach—it's easier than you ever thought possible.
Setting Up MySQL for Report Generation
Installing MySQL
Getting started with MySQL is easier than you might think. Here’s a simple, step-by-step guide to help you install MySQL on your system:
-
Download MySQL:
- Head over to the official MySQL website.
- Choose the version that matches your operating system (Windows, macOS, or Linux).
- Download the MySQL installer package.
-
Run the Installer:
- Once the download is complete, open the installer.
- Follow the prompts to begin the installation process. You’ll be asked to choose the setup type—select "Developer Default" for a full installation, or "Server Only" if you just need the database engine.
-
Configure MySQL Server:
- During installation, you’ll need to configure the MySQL Server. Choose the desired configuration options, such as setting up a root password, defining a port, and enabling TCP/IP connections.
- Make sure to note down the root password, as you’ll need it to access the server later.
-
Complete the Installation:
- After configuring the server, continue following the prompts to complete the installation. The installer will guide you through the remaining steps, including starting the MySQL Server and creating sample databases.
-
Verify the Installation:
- Once installation is complete, open the MySQL Command Line Client or MySQL Workbench.
- Log in using the root credentials you set during installation.
- Run a simple command like SHOW DATABASES; to ensure everything is set up correctly.
With MySQL installed and ready to go, you’re now equipped to start creating and managing databases, setting the stage for generating your reports. This foundation will make the rest of the process much smoother, whether you’re using CxReports or any other tool to handle your data.
Creating and Configuring a Database
Guide on Setting Up a Sample Database for Reporting
Before you can start generating reports, you need a well-organized database to work with. Here’s a straightforward guide to setting up a sample database in MySQL that you can use for your reporting needs.
1. Create a New Database:
- Open MySQL Workbench or the MySQL Command Line Client.
- To create a new database, run the following command:CREATE DATABASE ReportDB;
- This command creates a new database named ReportDB. You can name it whatever fits your project.
2. Select the Database:
- Before creating tables, select the newly created database:
USE ReportDB;
3. Create Tables:
- Next, you’ll need to create tables to store your data. Let’s start with a simple table for storing sales data:
CREATE TABLE Sales ( SaleID INT AUTO_INCREMENT PRIMARY KEY, ProductName VARCHAR(100), QuantitySold INT, SaleDate DATE, Revenue DECIMAL(10, 2));
- This command creates a Sales table with columns for the sale ID, product name, quantity sold, sale date, and revenue.
4. Insert Sample Data:
- Now, it’s time to populate your table with some sample data:INSERT INTO Sales (ProductName, QuantitySold, SaleDate, Revenue) VALUES('Widget A', 100, '2024-08-01', 1500.00),('Widget B', 50, '2024-08-02', 750.00),('Widget C', 200, '2024-08-03', 3000.00);
- This command adds three sample records to the Sales table, giving you data to work with when creating reports.
5. Verify the Data:
- To make sure everything is set up correctly, you can view the data in your table:SELECT * FROM Sales;
- This query will display all the records in your Sales table, showing the data you’ve just entered.
By following these steps, you’ve successfully created a sample database and populated it with data. This database is now ready to be used for generating reports, giving you a solid foundation to build on. Whether you’re working with sales data, financial records, or any other type of information, this setup process is essential for ensuring your reports are accurate and useful.
Using CxReports for Seamless Integration
How CxReports Integrates with MySQL Databases
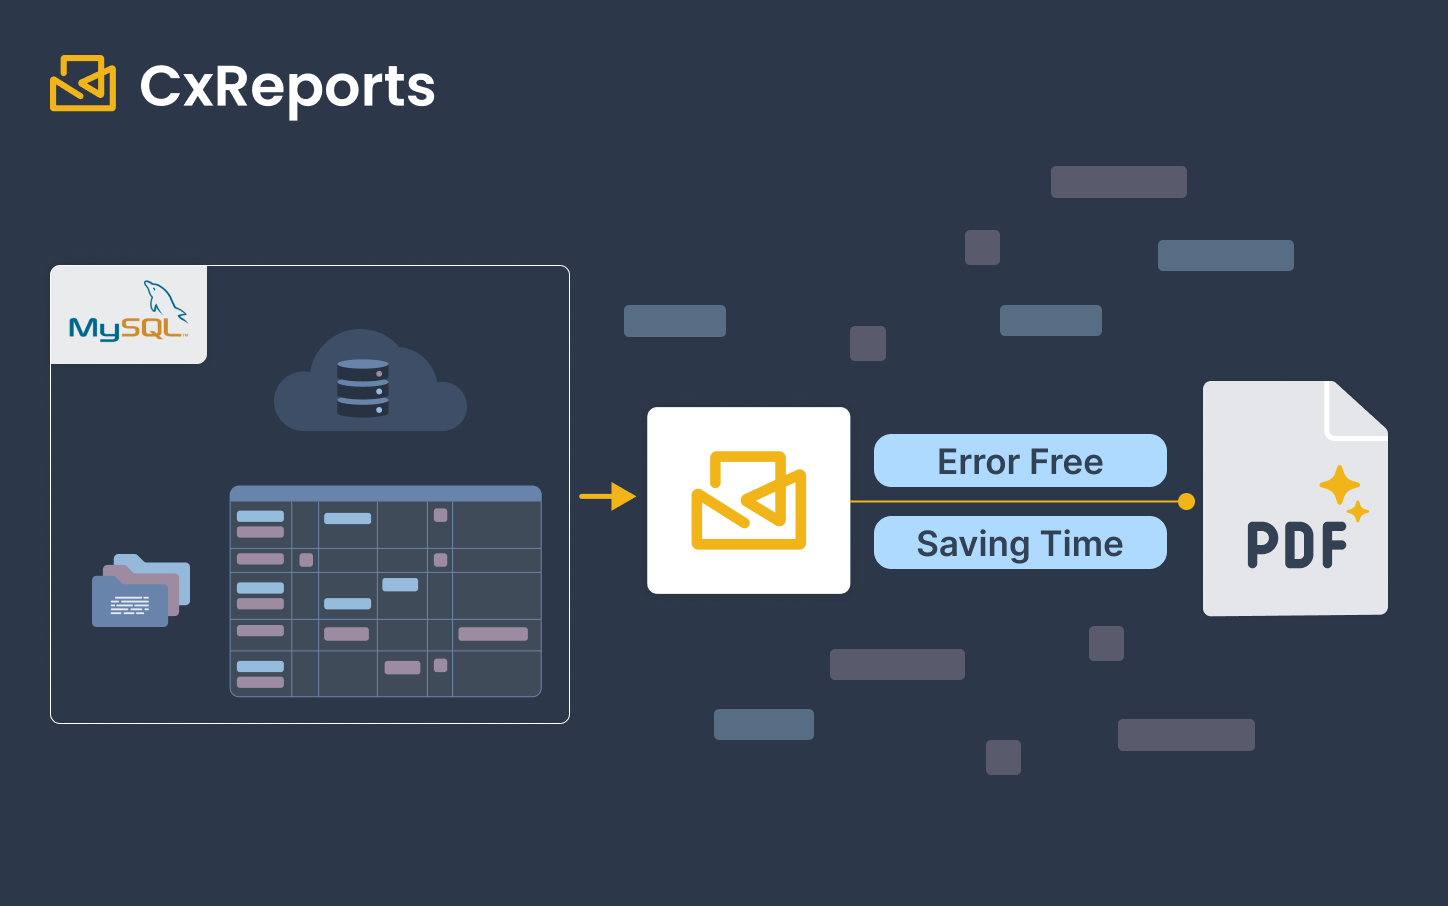
CxReports is designed to make the connection between your MySQL database and report generation as smooth as possible. Integrating CxReports with your MySQL database is straightforward—whether your data is stored locally or on a remote server, CxReports connects effortlessly to pull the information you need for your reports.
Once connected, CxReports automatically recognizes your database structure, allowing you to select the tables and fields you want to include in your reports. This integration not only simplifies the setup process but also ensures that your reports are always pulling the most up-to-date data from your MySQL database.
Benefits of Using CxReports
1. Streamlined Data Collection:
- CxReports simplifies data collection by automatically gathering the necessary data from your MySQL database. This eliminates the need for manual data exports, reducing the risk of errors and saving you valuable time.
2. Data Validation:
- One of the key strengths of CxReports is its built-in data validation features. Before generating a report, CxReports checks your data for inconsistencies or errors, ensuring that what you see in your final report is accurate and reliable. This means you can trust the information you’re presenting without worrying about manual mistakes or discrepancies.
3. Easy Data Formatting:
- Formatting your data for presentation can often be a time-consuming task, but CxReports makes it easy. With its intuitive WYSIWYG editor and a range of pre-designed templates, you can format your data into clean, professional-looking reports with just a few clicks. Whether you’re creating financial statements, sales reports, or any other type of document, CxReports ensures that your data is presented clearly and consistently.
Using CxReports to integrate with your MySQL database doesn’t just streamline the report generation process—it transforms it. By automating data collection, validating accuracy, and simplifying formatting, CxReports allows you to focus on what really matters: analyzing and using your data to make informed decisions.
Methods for Generating Reports in MySQL
Using MySQL Queries
When it comes to generating reports in MySQL, understanding how to write effective SQL queries is key. These queries allow you to extract the data you need, organize it in a meaningful way, and prepare it for reporting. Here’s a simple guide to get you started:
1. Extracting Data with Basic SQL Queries:
- The first step in generating a report is to pull the relevant data from your database. A basic SQL SELECT query is your go-to tool for this:SELECT ProductName, QuantitySold, RevenueFROM Sales;
- This query pulls the product names, quantities sold, and revenue from the Sales table. It’s straightforward but essential for gathering the information you’ll need for your report.
2. Grouping Data for Summaries:
- Often, you’ll want to group your data to create summaries, such as total sales by product or by date. The GROUP BY clause helps you do this:SELECT ProductName, SUM(Revenue) AS TotalRevenueFROM SalesGROUP BY ProductName;
- This query calculates the total revenue for each product by summing up the revenue values, grouped by the product name. This is useful for generating summary reports that show overall performance.
3. Filtering Data for Specific Reports:
- Sometimes, you need to focus on a specific subset of your data, such as sales from a particular month or product category. You can filter data using the WHERE clause:
SELECT ProductName, QuantitySold, RevenueFROM SalesWHERE SaleDate BETWEEN '2024-08-01' AND '2024-08-31';
- This query filters the sales data to only include records from August 2024. Filtering is crucial when you want your reports to reflect specific time periods, products, or other criteria.
4. Combining Grouping and Filtering:
- You can also combine grouping and filtering to create more targeted reports:
SELECT ProductName, SUM(Revenue) AS TotalRevenueFROM SalesWHERE SaleDate BETWEEN '2024-08-01' AND '2024-08-31'GROUP BY ProductName;
- This query not only filters the data to include only sales from August 2024 but also groups the results by product name, providing a total revenue figure for each product during that month.
By mastering these basic SQL queries, you can extract, group, and filter your data to create clear, meaningful reports in MySQL. These foundational skills are essential whether you’re working directly in MySQL or using a tool like CxReports to further enhance and automate your reporting process.
Generating Reports with CxReports
Step-by-Step Guide on Creating Reports Using CxReports’ WYSIWYG Editor
Creating reports with CxReports is designed to be as straightforward as possible, thanks to its user-friendly WYSIWYG editor. Here’s how you can generate a report in just a few simple steps:
1. Start a New Report:
- Begin by logging into CxReports and navigating to the Reports section.
- Click on “Create New Report” to get started. You’ll be prompted to choose a template, or you can start from scratch.
2. Select Your Data Source:
- Choose the MySQL database you’ve integrated with CxReports. The platform will automatically detect your tables and fields.
- Select the specific table or SQL query you want to use as the basis for your report.
3. Design Your Report Layout:
- Use the drag-and-drop WYSIWYG editor to arrange your data fields exactly how you want them. You can add tables, charts, and other visual elements with just a few clicks.
- If you’re using one of CxReports’ pixel-perfect templates, most of the work is already done for you. Simply customize the template to fit your needs by adjusting the layout, colors, and fonts.
4. Add Calculations and Grouping:
- Need to sum totals, calculate averages, or group data by category? CxReports makes it easy. Just select the fields you want to perform calculations on, and the editor will handle the rest.
- Group data by fields such as date, product, or any other relevant category to make your report more organized and insightful.
5. Preview and Adjust:
- Before finalizing your report, use the preview feature to see exactly how it will look. Make any necessary adjustments to ensure everything is aligned and the data is displayed correctly.
- CxReports helps prevent errors by highlighting any potential issues, such as missing data fields or incorrect calculations, so you can correct them before finalizing the report.
6. Automate Report Scheduling:
- One of CxReports’ standout features is its automated scheduling. Set up your report to be generated and sent out automatically at regular intervals—daily, weekly, or monthly—without any additional work from you.
- Simply choose the schedule that works for you, select the recipients, and let CxReports handle the rest.
7. Save and Share Your Report:
- Once you’re satisfied with your report, save it to your dashboard. You can export it in various formats, such as PDF or Excel, depending on your needs.
- CxReports also allows you to share reports directly via email, ensuring that everyone who needs access gets it without any extra steps.
Highlighting Key Features of CxReports
- Pixel-Perfect Templates: CxReports offers a range of professionally designed templates that ensure your reports look polished and consistent every time. These templates are fully customizable, so you can tweak them to match your brand’s style and specific reporting needs.
- Automated Scheduling: Never miss a reporting deadline again. With CxReports, you can set up automatic report generation and delivery, saving you time and reducing the risk of human error.
- Error Prevention: The platform’s built-in error-checking features help you catch issues before they become problems, ensuring that your reports are always accurate and reliable.
Using CxReports to generate your MySQL reports not only simplifies the process but also enhances the quality and professionalism of your output. With its intuitive tools and advanced features, CxReports makes it easy to create, customize, and automate reports that meet your exact needs.
Advanced Reporting Techniques with CxReports
Customizing Report Layouts
One of the standout features of CxReports is its ability to customize report layouts to fit your specific business needs. Whether you're creating financial statements, sales reports, or any other type of document, CxReports makes it easy to design and format your reports exactly how you want them. Here’s how you can take advantage of its drag-and-drop editor and templates.
1. Using the Drag-and-Drop Editor:
Start with a Blank Canvas or a Template:
- CxReports gives you the flexibility to start from scratch or use a pre-built template. If you’re looking for complete control, select a blank canvas and begin adding elements like tables, charts, and text fields.
Drag, Drop, and Arrange Elements:
- The editor allows you to simply drag and drop the elements you need onto your report. Whether it’s a data table, a chart, or a header, you can place it exactly where you want it. The intuitive interface ensures that you don’t need any design experience to create a professional-looking report.
Resize and Align with Ease:
- Adjusting the size of elements and aligning them is straightforward with CxReports. You can easily resize tables, charts, and text boxes to fit your layout, ensuring everything looks clean and organized. The editor also provides alignment guides to help you keep everything perfectly lined up.
2. Creating and Modifying Templates:
Select a Template for Specific Needs:
- CxReports offers a range of templates designed for different types of reports, such as Financial Reports, Sales Reports, Invoices, and more. These templates are a great starting point, especially if you need a quick turnaround.
Customize to Fit Your Brand:
- Every template in CxReports is fully customizable. You can change colors, fonts, and layout styles to match your company’s branding guidelines. This ensures that every report you generate looks consistent and professional.
Add or Remove Data Fields:
- Templates are flexible. If you need to add additional data fields to capture more information, it’s as simple as dragging a new field into your layout. Conversely, if certain fields aren’t needed, you can remove them without affecting the overall design.
Save Custom Templates for Future Use:
- Once you’ve created a layout that works perfectly for your needs, you can save it as a custom template. This means you can reuse the design for future reports, saving you time and ensuring consistency across all your documents.
3. Tailoring Reports for Different Audiences:
Modify Reports Based on Audience Needs:
- CxReports allows you to tailor reports for different stakeholders. For example, a financial report for executives might focus on high-level summaries and key metrics, while a report for the finance team might include more detailed tables and calculations. You can easily adjust the content and format of your reports based on who will be reading them.
Use Conditional Formatting for Emphasis:
- Highlight critical data points or trends with conditional formatting. This feature lets you automatically apply different styles (like bold text or colored backgrounds) to data that meets certain criteria, helping important information stand out.
By taking advantage of CxReports' customization features, you can create reports that not only convey the necessary information but also reflect your brand's professionalism and attention to detail. Whether you’re designing a new layout or modifying an existing template, CxReports gives you the tools to ensure your reports are tailored perfectly to your business needs.
Visualizing Data
Creating Charts and Graphs with CxReports
One of the most effective ways to make your reports more engaging and easier to understand is by incorporating visual elements like charts and graphs. CxReports makes this process straightforward, allowing you to turn raw data into clear, impactful visuals that enhance your report’s readability.
1. Choosing the Right Chart or Graph:
Identify Your Data Type:
- The first step is to determine the type of data you want to visualize. For example, if you’re showing trends over time, a line chart might be best. If you’re comparing different categories, a bar or pie chart could be more appropriate.
Select from Built-in Options:
- CxReports offers a variety of chart types, including bar charts, line charts, pie charts, and more. You can select the chart that best fits your data directly from the drag-and-drop editor.
2. Adding Data to Your Charts:
Drag and Drop Data Fields:
- Once you’ve chosen a chart type, you can easily add data to it by dragging and dropping fields from your MySQL database. CxReports automatically populates the chart with the selected data, giving you a real-time preview of how it looks.
Customize Data Ranges and Labels:
- You have the flexibility to customize the data ranges and labels to ensure that your charts are as clear and informative as possible. You can adjust axes, change data series, and rename labels to better reflect the information being presented.
3. Customizing Visual Elements:
Style Your Charts:
- CxReports allows you to customize the appearance of your charts to align with your brand’s visual identity. You can adjust colors, fonts, and other design elements to ensure consistency with your overall report layout.
Add Legends and Annotations:
- To make your charts even more informative, you can add legends and annotations. Legends help readers understand what each color or pattern represents, while annotations allow you to highlight specific data points or trends directly on the chart.
4. Enhancing Report Readability with Visuals:
Integrate Charts Seamlessly:
- Position your charts strategically within your reports to enhance the overall flow and readability. Placing visuals close to the relevant text or data tables helps reinforce the information and makes the report easier to digest.
Use Visuals to Highlight Key Insights:
- Charts and graphs are particularly useful for highlighting key insights and trends. For example, a bar chart showing a spike in sales during a particular month can quickly convey a message that might be buried in a table of numbers.
5. Exporting and Sharing Visual Reports:
High-Quality Exports:
- When your report is complete, CxReports ensures that all visual elements are preserved in high quality, whether you’re exporting to PDF, Excel, or another format. This means your charts and graphs will look just as clear and professional in the final report as they do in the editor.
Interactive Sharing:
- If you need to share reports digitally, CxReports supports interactive elements, allowing recipients to explore charts and graphs in more detail, further enhancing the report's impact.
By integrating charts and graphs into your reports, you’re not just adding visual appeal—you’re making complex data more accessible and easier to understand. CxReports gives you all the tools you need to create these visuals effortlessly, helping you communicate your insights more effectively.
Automated Report Scheduling
Setting Up Scheduled Reports in CxReports
The ability to automate report generation is one of the most powerful features of CxReports, ensuring that your reports are delivered on time without any manual effort. Here’s how you can set up scheduled reports in CxReports to keep your team informed and your operations running smoothly.
1. Access the Scheduling Feature:
- Start by logging into CxReports and navigating to the Reports section where you manage your report templates and generated reports.
- Choose the report you want to automate from your list of saved reports. This could be anything from a daily sales summary to a monthly financial statement.
2. Set Up the Schedule:
- CxReports allows you to set the frequency of your report generation. You can choose to run reports daily, weekly, monthly, or at any custom interval that suits your business needs.
- Specify the exact time and date when you want the report to be generated and delivered. This ensures that your team receives the report exactly when they need it, whether it’s first thing in the morning or at the end of the business day.
3. Configure Recipients:
- Enter the email addresses of the individuals or groups who should receive the report. You can add multiple recipients, ensuring that everyone who needs the report gets it on time.
- Customize the delivery format (e.g., PDF, Excel) to match the preferences of your recipients. CxReports also allows you to include a custom message with each report, providing context or instructions as needed.
4. Review and Confirm:
- Before finalizing, review all the settings to ensure everything is correct—frequency, time, recipients, and format. This step helps prevent any mistakes and ensures that the report scheduling aligns with your expectations.
- Once you’re satisfied, activate the schedule. CxReports will now automatically generate and send the report according to the settings you’ve configured, freeing you from the need to remember and execute these tasks manually.
5. Monitor and Adjust:
- After setting up the schedule, you can monitor the status of your scheduled reports through CxReports’ dashboard. This lets you confirm that reports are being sent out as planned and received by the intended recipients.
- If your reporting needs change, CxReports makes it easy to adjust the schedule. You can change the frequency, update recipients, or even pause the schedule temporarily if needed.
By automating your report scheduling with CxReports, you ensure that important data is consistently delivered to your team without the risk of delays or errors. This feature not only saves you time but also enhances the reliability of your reporting process, making sure that everyone stays informed and up to date with the latest information.
Best Practices for MySQL Report Generation
Optimizing Query Performance
Efficient SQL queries are the backbone of fast and reliable reports. Poorly written queries can slow down your database and make report generation a time-consuming process. Here are some practical tips for optimizing your SQL queries, using examples from CxReports’ templates to show how it’s done.
1. Select Only What You Need:
- Tip: When writing SQL queries, avoid using SELECT *. Instead, specify only the columns you need for your report.
- **Example:**SELECT ProductName, QuantitySold, RevenueFROM Sales;This query is more efficient than selecting all columns, as it reduces the amount of data processed and returned.
2. Use Indexes Wisely:
- Tip: Indexes can significantly speed up your queries, especially when filtering large datasets. Ensure that your tables have indexes on the columns you frequently use in WHERE clauses.
- Example:
CREATE INDEX idx_sale_date ON Sales(SaleDate);By indexing the SaleDate column, queries that filter by date will run much faster.
3. Filter Early with WHERE Clauses:
- Tip: Apply filtering conditions as early as possible in your query to reduce the amount of data processed.
- Example:
SELECT ProductName, SUM(Revenue) AS TotalRevenueFROM SalesWHERE SaleDate BETWEEN '2024-08-01' AND '2024-08-31'GROUP BY ProductName;Filtering the data by date before grouping it reduces the dataset size, making the query more efficient.
4. Avoid Complex Joins When Possible:
- Tip: While joins are necessary in many cases, they can slow down queries, especially with large tables. Simplify your joins or, if possible, retrieve data from a single table.
- Example: If you only need data from one table, avoid unnecessary joins:
SELECT CustomerName, TotalSalesFROM CustomersWHERE TotalSales > 1000;This query avoids joins and focuses directly on the data needed.
5. Use Aggregations Sparingly:
- Tip: Aggregating data, such as using SUM() or COUNT(), can be resource-intensive. Use these functions only when necessary, and ensure the dataset is as small as possible before aggregation.
- Example:
SELECT ProductName, COUNT(*) AS SalesCountFROM SalesWHERE SaleDate >= '2024-01-01'GROUP BY ProductName;Filtering by date before counting reduces the workload on the database.
6. Leverage Query Caching:
- Tip: If you run the same queries frequently, consider using query caching to speed up response times. Many SQL servers support caching, storing the results of queries that are run often.
- CxReports Advantage: CxReports takes advantage of built-in caching mechanisms to ensure that frequently accessed data is retrieved quickly, further optimizing the performance of your reports.
7. Test and Monitor Query Performance:
- Tip: Regularly test your queries to identify performance bottlenecks. Use tools like EXPLAIN to understand how your queries are executed and where improvements can be made.
- Example:1. sql2. Copy code EXPLAIN SELECT ProductName, SUM(Revenue) FROM Sales GROUP BY ProductName;Running EXPLAIN on your query provides insight into how the database processes it, helping you identify areas for optimization.
By following these tips, you can write SQL queries that are both efficient and effective, ensuring that your reports run quickly and smoothly. CxReports’ templates are built with these best practices in mind, helping you generate high-performance reports without the hassle.
Ensuring Data Accuracy with CxReports
When it comes to generating reports, accuracy is non-negotiable. Errors in your data can lead to flawed insights and poor decision-making. CxReports helps you maintain the highest level of accuracy through built-in validation and error prevention features. Here’s how CxReports ensures that your reports are both reliable and precise.
1. Data Validation at the Source:
- Real-Time Validation: CxReports checks your data in real-time as you input it or connect to your database. This immediate validation helps catch errors at the source, such as incorrect data types or missing fields, before they can impact your report.
- Example: When setting up a report template, CxReports alerts you if a required data field is missing or if the data type doesn’t match the expected format, allowing you to correct the issue right away.
2. Automatic Data Integrity Checks:
- Consistency Checks: CxReports automatically performs consistency checks across your data. This includes ensuring that totals match across different sections of a report, or that dates are in the correct order, preventing any discrepancies that could lead to incorrect conclusions.
- Example: If you’re generating a financial report, CxReports will verify that the sum of all subcategories matches the overall total, ensuring that every number adds up correctly.
3. Error Prevention Through Templates:
- Pre-Built Templates with Built-In Validation: CxReports offers a range of pre-built templates that come with built-in validation rules. These templates are designed to reduce the risk of errors by guiding you through the process of data selection and report generation.
- Example: Using a CxReports financial statement template, you can be confident that all necessary data points are included and correctly formatted, minimizing the chances of errors slipping through.
4. Custom Validation Rules:
- Tailored Accuracy: CxReports allows you to set custom validation rules specific to your business needs. Whether it’s ensuring that all entries meet certain criteria or validating complex calculations, these rules help keep your data accurate.
- Example: You might set a rule that flags any sales transactions where the revenue field is zero, prompting a review before the report is finalized.
5. Review and Approve Workflow:
- Final Checks Before Publishing: Before a report is finalized and distributed, CxReports offers a review and approval process. This allows multiple team members to check the report for accuracy, making sure that any issues are caught and resolved before the report reaches its audience.
- Example: A sales report can be reviewed by both the sales and finance teams to ensure that all figures are accurate and that the report aligns with both departments’ records.
6. Audit Trails for Transparency:
- Track Changes: CxReports keeps an audit trail of changes made to reports and data, allowing you to trace back and identify the source of any issues that arise. This transparency helps in maintaining data accuracy over time and during audits.
- Example: If a discrepancy is found in a report, you can use the audit trail to see who made changes, what was altered, and when it happened, making it easier to correct and prevent future errors.
By utilizing these validation and error prevention features, CxReports helps you maintain the integrity of your data and ensures that your reports are as accurate as possible. This focus on accuracy not only enhances the reliability of your reports but also boosts confidence in the decisions based on them.
Maintaining Report Confidentiality
Protecting the confidentiality of your reports is critical, especially when dealing with sensitive business data. CxReports offers a range of security features designed to keep your data safe and secure. Here’s how CxReports helps you maintain report confidentiality.
1. On-Premise Hosting for Maximum Control:
- Data Security: By allowing you to host CxReports on your own servers, you maintain full control over your data. This ensures that sensitive information never leaves your secure environment, reducing the risk of unauthorized access or data breaches.
- Example: Financial institutions or healthcare providers can use CxReports’ on-premise hosting to ensure compliance with strict data protection regulations, knowing that all data remains within their secure network.
2. Role-Based Access Control:
- Customized Access Levels: CxReports enables you to set role-based access controls, ensuring that only authorized personnel can view, edit, or distribute reports. This means you can restrict access to sensitive data based on the user’s role within the organization.
- Example: A company might grant full access to financial reports only to senior management, while providing read-only access to specific departments, ensuring that sensitive financial data is only seen by those who need it.
3. Data Encryption:
- End-to-End Encryption: CxReports uses encryption to protect your data both in transit and at rest. This means that even if data is intercepted or accessed without authorization, it remains unreadable and secure.
- Example: If a report containing sensitive customer information is being transmitted over the network, CxReports ensures that the data is encrypted, preventing any unauthorized parties from accessing it.
4. Secure Report Sharing:
- Controlled Distribution: CxReports allows you to securely share reports via email or internal platforms, with options to password-protect the reports or set expiration dates on access links. This ensures that even shared reports are protected.
- Example: When sending a confidential report to a client, you can use CxReports to add a password and set the report link to expire after a certain period, ensuring that the data is only accessible to the intended recipient for a limited time.
5. Audit Trails for Accountability:
- Tracking Access and Changes: CxReports maintains a detailed audit trail of who accessed or modified reports and when these actions took place. This helps ensure accountability and transparency, making it easier to detect and investigate any unauthorized activity.
- Example: If there’s a concern about who viewed a sensitive report, the audit trail can quickly identify all individuals who accessed it, providing a clear record for further action.
6. Regular Security Updates:
- Ongoing Protection: CxReports regularly updates its security features to protect against the latest threats. This proactive approach ensures that your data remains secure even as potential risks evolve.
- Example: By keeping your CxReports system updated, you benefit from the latest security patches and enhancements, helping to safeguard your reports against new vulnerabilities.
By implementing these robust security measures, CxReports ensures that your sensitive data remains confidential and protected at all times. Whether you’re managing internal reports or sharing information with external stakeholders, CxReports provides the tools you need to maintain the highest levels of data security and confidentiality.
Conclusion
Generating reports in MySQL can be a straightforward and rewarding process when you know the right steps. By following this guide, you’ve learned how to create effective reports from start to finish—whether it’s setting up your database, writing efficient SQL queries, or using CxReports to streamline and automate the entire process. These tools and techniques are designed to help you turn raw data into meaningful insights that can drive better decisions for your business.
The value you’ve gained here isn’t just about saving time—it’s about gaining confidence in the reports you produce. With CxReports, you’ve seen how easy it is to ensure accuracy, maintain security, and present your data in a clear and professional way. As you apply these strategies, you’ll find that generating reports in MySQL becomes a powerful tool in your everyday workflow, helping you stay on top of your data and make informed choices with ease.Ready to make reporting easier? Give CxReports a try. With automated scheduling and easy-to-use templates, you'll save time and get better insights. Get started with a free license and see how CxReports can simplify your workflow.