Most IT organisations with a legacy reporting stack have stopped asking whether they should modernise. The question they are stuck on is simpler and harder: how do we pay for it?
The cost is not software licences or infrastructure. It is templates. Hundreds of them, built over a decade by developers who have since moved on, many of them doing things no one fully remembers. The reporting platform — SSRS, JasperReports, BIRT — is not what makes migration expensive. The accumulated report logic embedded in proprietary file formats is what makes it expensive. And until recently, the only way to move that logic was manually, one template at a time.
This post looks at what these legacy tools share structurally, why migration economics have changed with AI-assisted report design, and how the concept mappings work for teams migrating from SSRS or JasperReports to a modern platform.
A Landscape Built for a Different Era
SSRS, JasperReports, BIRT, and Crystal Reports emerged in roughly the same period — the late 1990s and early 2000s — and they reflect the infrastructure assumptions of that era: Windows or Java application servers, direct database connections, pixel-perfect PDF output, and a design experience built for specialists.
Despite their different origins — Microsoft bought and integrated SSRS into SQL Server, JasperReports came out of the Java open-source ecosystem, BIRT was an Eclipse Foundation project — they converged on the same structural model: a band-based layout engine, file-based template storage in proprietary or semi-proprietary XML formats, a server process for rendering, and expression languages tied to the host platform.
These constraints were reasonable when reports were generated on-premise, printed or emailed from an internal server, and consumed by internal teams. They are a poor fit for cloud-native infrastructure, modern API-driven data integration, and the expectation that non-technical users should be able to create and modify reports without writing VB.NET expressions or Java scriptlets.
The result is a familiar situation: the reporting platform is technically functional, nobody wants to maintain it, and nobody wants to pay for the migration.
Why Template Debt Is the Real Blocker
The misframing that causes legacy reporting migrations to stall is conflating tool replacement with template migration. They are different problems with different costs.
Replacing the tool — licensing a new platform, setting up environments, onboarding the team — is the smaller problem. It takes weeks, not months.
Migrating templates is the larger problem. A decade of reports means a decade of accumulated logic: SQL queries that only work against specific schema versions, expressions that implement business rules nobody documented, subreports that depend on other subreports, parameters with complex cascading dependencies. None of this is transferable between tools. It has to be translated, and translation requires a human who understands both the original tool and the new one.
Three factors make this worse than it sounds.
The people who built these reports are often gone. Legacy reporting projects were built by developers who have since changed roles, left the organisation, or retired. The institutional knowledge that explains why a particular report does what it does lives in version history and email threads that no one can find. A migration developer encountering an unfamiliar .rdl or .jrxml file has to reverse-engineer the intent from the output.
Many reports are not actively used. Organisations consistently discover during migration inventories that 30–50% of their report catalogue has not been run in the past year. Migrating unused reports is pure waste — but without an inventory, there is no way to know which ones those are before the work starts.
"Migration" becomes "rewrite." Developers migrating legacy reports often improve them as they go — fixing data quality issues, simplifying overcomplicated logic, adding better error handling. This is natural and sometimes valuable, but it expands scope and makes estimates unreliable. A two-day migration task becomes a four-day redesign.
The practical result: migration projects that appear feasible at the planning stage — 200 reports at two days each — become 18-month commitments that lose executive support partway through.
How AI-Assisted Design Changes the Starting Position
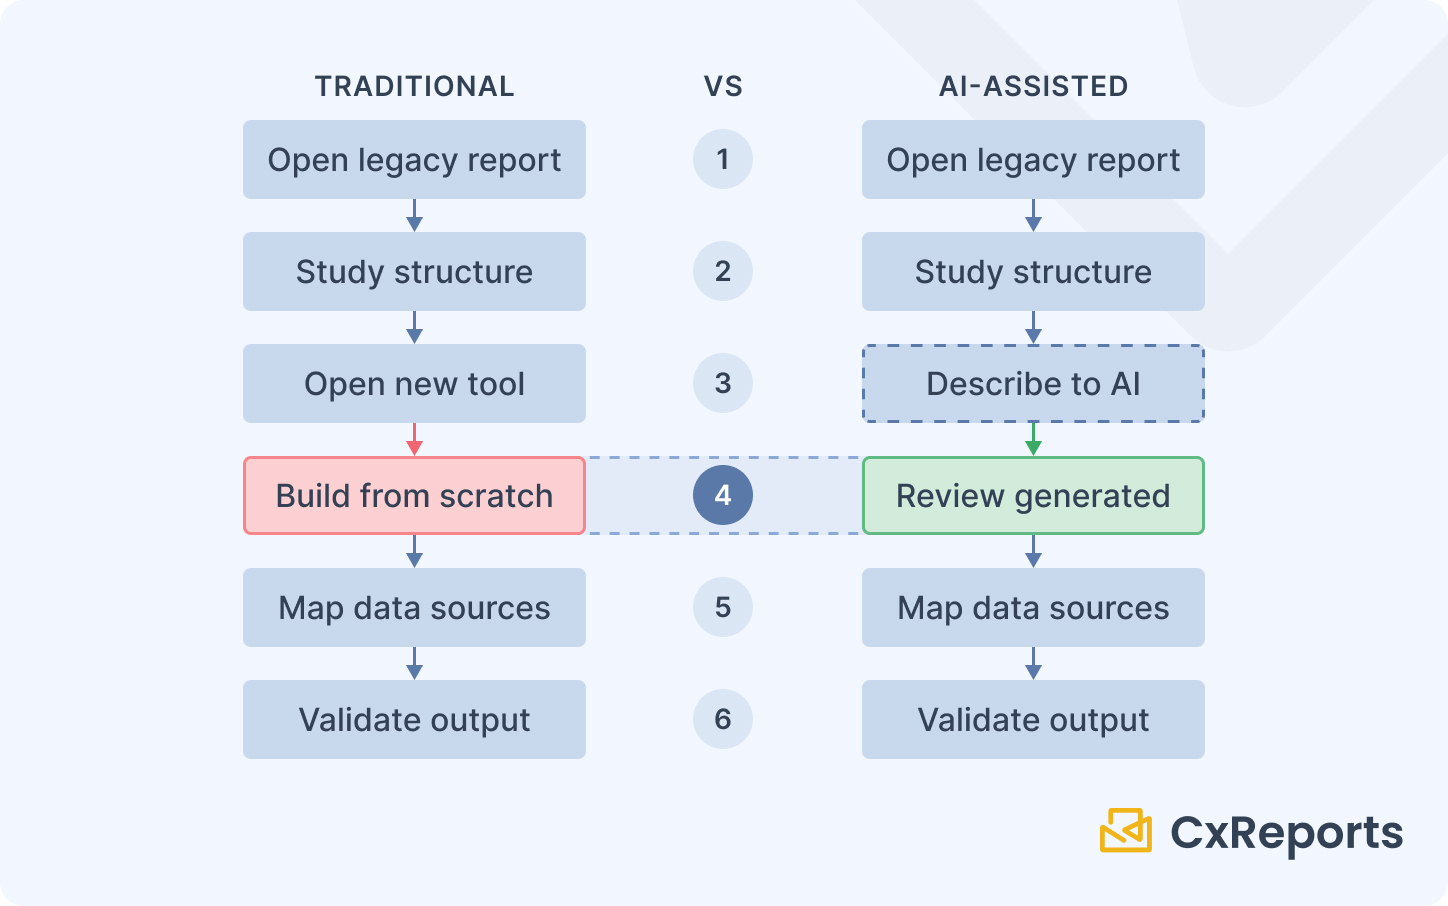
The traditional migration workflow has one defining characteristic: it starts with an empty canvas. A developer studies the old report, then begins building the equivalent in the new tool from nothing. The old tool is a reference document. All construction happens manually.
AI-assisted report design moves the starting position. Instead of building from nothing, the developer describes the report — its sections, the data it presents, the layout it should follow — and the AI assistant interprets that description and generates a working template structure. The developer begins with a populated canvas to review, validate, and refine rather than a blank one to fill.
This applies regardless of which legacy tool you are migrating from. The developer's source material is still the original report — open the old .rdl or .jrxml, understand what it does — but the construction step is replaced by a description-and-review step. The skill requirement shifts from "build this report architecture from scratch" to "validate that this AI-generated structure correctly implements the original report's intent and maps the data sources accurately."
The practical impact is a reduction in per-template migration time. Complex templates still take meaningful effort — data source mapping, expression translation, output validation against the original — but the proportion of that effort spent on layout construction decreases. Across a large migration portfolio, that shift changes the feasibility calculation.
SSRS: What Migrates and What Translates
SQL Server Reporting Services is the most common legacy reporting platform in organisations running Microsoft infrastructure. SSRS reports are stored as RDL (Report Definition Language) files — XML-based, but not importable into other platforms. The migration from SSRS is a rebuild, not an import.
Datasets → Data sources. SSRS reports define named datasets — queries against SQL Server that produce result sets for different sections of the report. In CxReports, these become data sources: SQL queries, API calls, or JavaScript computations configured within the report. The query logic transfers directly; the wiring to the template sections needs to be rebuilt.
Tablix (tables and matrices) → Tables. SSRS uses the Tablix data region for both flat tables and pivot-style matrices. In CxReports, standard tables handle flat tabular output. Cross-tab and matrix patterns are handled through data transformation — typically in the SQL query or a JavaScript data source — feeding a flat table.
Expressions (VB.NET) → Template expressions and JavaScript data sources. SSRS expressions use VB.NET syntax for calculated fields, conditional formatting, and text formatting. Simple expressions — string concatenation, date formatting, basic arithmetic — translate straightforwardly. Complex business logic embedded in expressions is better extracted into a JavaScript data source in CxReports, where it can be tested and maintained independently of the template.
Report parameters → Report parameters. SSRS parameters map closely to CxReports report parameters — both support typed values, cascading lookups (where one parameter filters the options for another), and required/optional configuration. The parameter structure is the easiest part of an SSRS migration to reproduce.
Subreports → Subreports. SSRS subreports — separate report files embedded within a parent report — map directly to CxReports Subreports, which are self-contained report units with their own data sources, parameters, and layouts. This is a clean concept-level match.
Subscriptions → Scheduled email delivery. SSRS subscriptions deliver reports to email or file shares on a schedule. CxReports email jobs handle this with a schedule, recipient list, and parameter mapping — reports attach to the email automatically at generation time.
Report Server / SSRS infrastructure → CxReports managed service or on-premise deployment. SSRS runs as a Windows service integrated with SQL Server. CxReports can be deployed on-premise (Docker or Windows service) or used as a managed cloud service. For teams migrating off Windows Server infrastructure entirely, CxReports Cloud removes the need to maintain a reporting server at all. Teams that need to reach existing on-premise SQL Server databases from CxReports Cloud can do so through the Data Agent, which establishes a secure outbound connection without requiring firewall changes.
JasperReports and BIRT: What Migrates and What Translates
JasperReports and BIRT share a design philosophy — both are band-based Java reporting frameworks where report structure is defined by horizontal bands that stack vertically. A Jasper report consists of bands: Title, Page Header, Column Header, Detail (repeating rows), Group Header, Group Footer, Column Footer, Page Footer, Summary. BIRT follows a similar model.
Bands → Page structure and repeating sections. The band model maps to CxReports' page structure, but not one-to-one. Title and Summary bands become content on specific pages. Page headers and footers become page template content in CxReports. The Detail band — the repeating row section — maps to a repeating element or a table within the CxReports template. Group Header and Footer bands, which surround each group of data in Jasper, need to be rethought as sections within a CxReports table or as subreport repetitions.
Parameters → Report parameters. Jasper parameters map closely to CxReports parameters — typed values passed into the report to drive queries and display logic.
Fields and variables → Data source fields and JavaScript data sources. Jasper fields are mapped to data source columns. Jasper variables — computed values that accumulate across rows (running totals, counts) — typically move to the SQL query layer or a JavaScript data source in CxReports.
Scriptlets (Java code) → JavaScript data sources. JasperReports scriptlets allow developers to write Java code that runs at specific points during report generation — before/after groups, before/after the report. This is typically the most complex migration element. The logic needs to be extracted, understood, and reimplemented as JavaScript data source logic in CxReports.
Subreports → Subreports. Jasper subreports — embedded report units with their own parameters and data — map cleanly to CxReports Subreports.
Jaspersoft Server subscriptions → Scheduled email delivery. If the organisation is using Jaspersoft Server for scheduled report delivery, this maps to CxReports email jobs with parameter mapping and schedule configuration.
The Migration Strategy That Actually Works
The most common mistake in legacy reporting migrations is trying to migrate everything before cutting over. This produces a project that runs for 18 months, loses momentum, and ends with the organisation still running two parallel systems — the legacy platform and a partially-migrated new platform — indefinitely.
The strategy that works is the opposite: new reports go to the new platform immediately, and legacy reports migrate in priority order over time.
From the day you commit to CxReports as your reporting platform, all new report requests — regardless of how simple — are built there. This does two things. It builds team familiarity with the new tool on real production work, not just migration exercises. And it prevents the legacy report catalogue from growing, which is the single most important variable in migration cost.
Legacy reports then migrate according to a simple prioritisation framework. Reports that are high-use and frequently modified are the best candidates for early migration — they justify the investment and the team benefits immediately from the improved development experience. Reports that are rarely used and never changed can migrate last, or not at all if the decision is made to retire them. Reports that nobody can explain the purpose of should be questioned before migrating at all.
During the transition period, two systems run in parallel. This is manageable if the boundary is clear — new reports live in CxReports, legacy reports stay in SSRS or Jasper until they are migrated. The ambiguity that kills parallel operation is when the boundary is fuzzy, with some new reports in the old system and some legacy reports partially rebuilt in the new one.
Cutover for each report follows the same discipline: run both versions against the same data for at least one full reporting cycle, compare the outputs numerically, resolve any discrepancies, and then retire the legacy version. Retiring actively — not just adding the new version — is what prevents the indefinite parallel operation problem.
Getting Started
| Legacy tool concept | CxReports equivalent |
|---|---|
| SSRS dataset (SQL query) | Data source (SQL) |
| SSRS tablix (table/matrix) | Table component |
| SSRS expression (VB.NET) | Template expression / JavaScript data source |
| SSRS subreport | Subreport |
| SSRS subscription (scheduled delivery) | Email job with schedule + parameter mapping |
| Jasper Detail band (repeating rows) | Repeating element / table rows |
| Jasper Group Header/Footer bands | Table grouping / subreport repetition |
| Jasper variable (running total) | JavaScript data source |
| Jasper scriptlet (Java logic) | JavaScript data source |
| Jasper/SSRS subreport | Subreport |
| On-premise database from cloud | Data Agent (secure outbound tunnel) |
| Report parameters (any tool) | Report parameters |
Documentation:
If your organisation is evaluating migration from SSRS or JasperReports, book a session with the CxReports team. We can walk through the concept mapping for your specific report types and demonstrate the AI-assisted template workflow.