Financial reports are among the most structurally predictable documents in existence. A profit and loss statement follows a defined hierarchy: revenue, cost of goods sold, gross profit, operating expenses, operating income, other income and expenses, net income. A balance sheet balances. An investment performance summary has a standard anatomy that any institutional reader recognises immediately. A client portfolio statement from any reputable firm contains the same categories, in roughly the same order, with the same number precision conventions.
This predictability is usually framed as a constraint. It is actually the property that makes financial report templates ideal candidates for AI-assisted design. Predictable structure means AI can generate accurate first drafts from concise descriptions — not because it is reading your specific data, but because it knows what a P&L looks like.
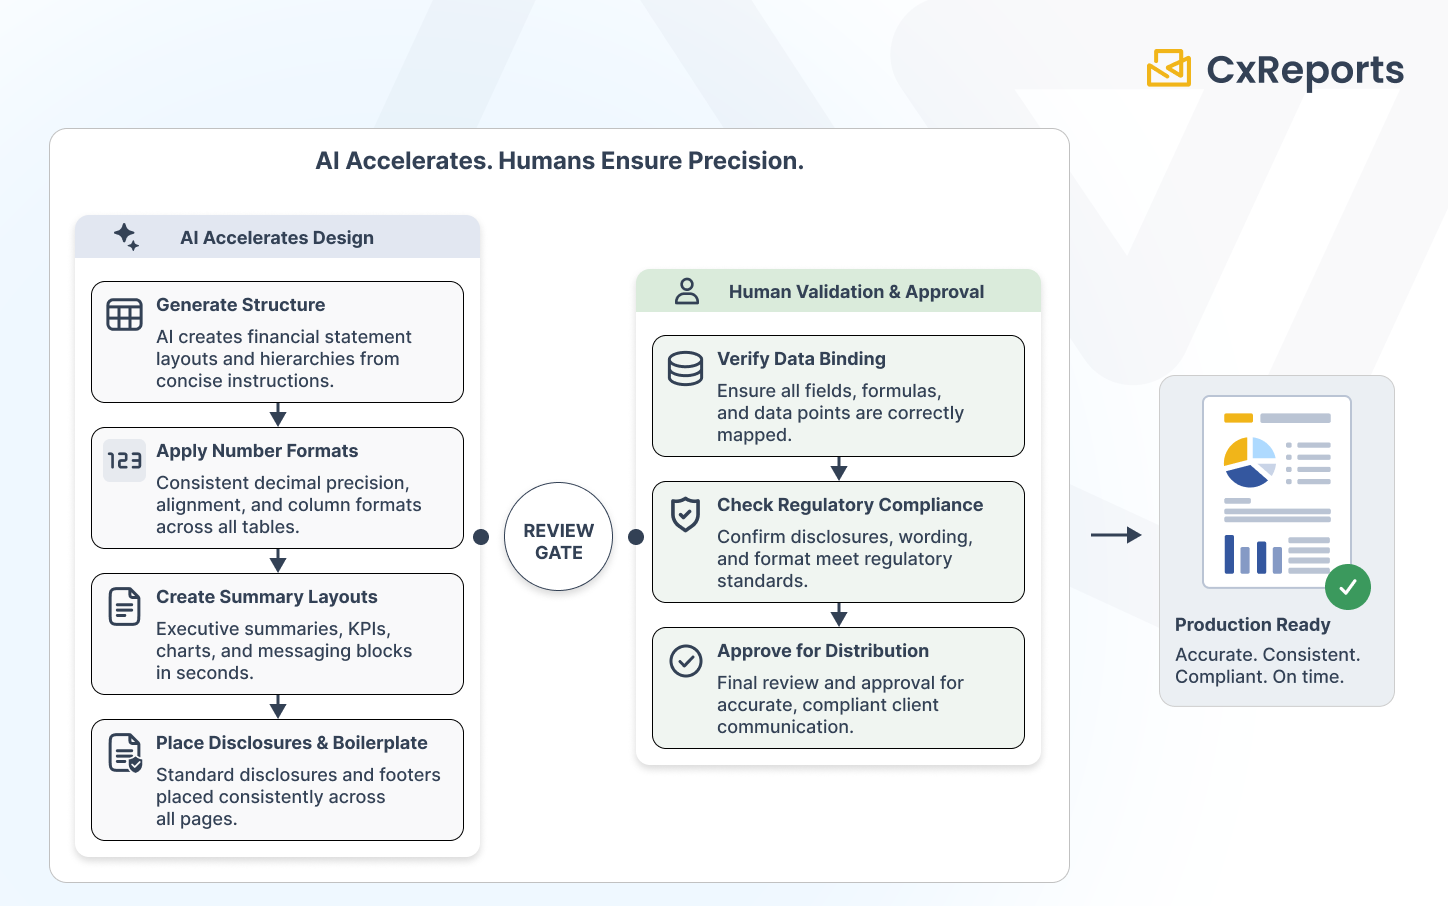
The productive framing is this: AI gives finance teams speed on the construction work that is currently the bottleneck. The precision and consistency that financial documents require come from the human review gate that follows. These are not competing goals. They are sequential steps, and understanding which belongs to AI and which belongs to your team is what makes the combination work in practice.
What Financial Report Design Actually Requires
Before examining what AI handles, it is worth being specific about what makes financial report design demanding relative to other document types.
Decimal precision and number alignment. Financial documents carry specific decimal conventions that must be consistent throughout. A portfolio statement where returns are shown to two decimal places in one table and one decimal place in another is not a minor inconsistency — it implies different precision in the underlying data. Tables where numeric columns are left-aligned rather than decimal-aligned are harder to read and look unprofessional. These requirements are not onerous once configured correctly, but they must be configured deliberately and verified across every table, every column, and every number format in the template.
Column and section structure in financial tables. The column structure of a financial table carries semantic meaning. In a P&L, the indentation hierarchy of line items (gross revenue, less: returns and allowances, net revenue) communicates the aggregation logic. A balance sheet where current assets and non-current assets are not clearly separated at the structural level misrepresents the document's meaning. A comparative period table where the column order (current period, prior period, variance) is inconsistent across sections creates reading errors.
Regulatory and disclosure requirements in headers and footers. Client-facing financial documents carry mandated disclosures — investment risk warnings, regulatory body registrations, past performance caveats, data source attributions. These are not optional footnotes. They are compliance requirements, and their presence, placement, and exact wording are often prescribed. A template that is beautifully designed but missing a required footer disclosure is not production-ready.
Brand and format consistency across document families. Finance teams typically produce a family of documents — quarterly statements, annual reviews, interim reports, trade confirmations — that must share a visual identity. Inconsistency in how the company logo is placed, how section headers are styled, or how summary boxes are formatted across a document family creates a perception of disorganisation that clients notice.
Where AI Adds Speed: The Structural Patterns It Handles Well
The structural patterns in financial reports are well-established enough that AI can generate accurate starting points from concise descriptions. The following categories represent where AI assistance produces the most useful output.
Table structures for standard financial statements. P&L structures, balance sheet layouts, cash flow statement formats — these follow conventions that AI reproduces reliably from a description. A prompt describing a three-period comparative income statement produces a table with the correct hierarchy, appropriate header rows, and subtotal positioning. What the AI produces is structural — the correct skeleton for the document. Data binding is still the designer's task.
Consistent column formatting across financial tables. Instructing AI to apply consistent decimal precision, decimal alignment, and column header styling across all numeric tables in a report is a task well suited to AI execution. The instruction is "apply this formatting convention to every table in the document" — the AI applies it; the designer verifies the result is consistent and correct.
Repeating disclosure and boilerplate sections. Standard disclosure paragraphs, regulatory notices, and boilerplate sections that appear on every page or at the end of every document are straightforward for AI to place and format. The text itself needs to be written and approved separately — AI is placing and styling it, not generating it. But ensuring the disclosure block appears in the correct position on every relevant page type, with consistent margins and typography, is exactly the kind of repetitive structural task that AI executes reliably.
Cover pages and executive summary layouts. Client-facing financial documents typically open with a cover page carrying the client name, report period, and visual brand elements, followed by an executive summary with key metrics highlighted prominently. These layouts follow predictable patterns — a well-described prompt generates a working starting point for both sections in minutes.
Section structure for multi-asset portfolio reports. Portfolio reports for clients with holdings across multiple asset classes follow a recognisable pattern: summary overview, allocation chart, per-asset-class performance table, individual holding detail, notes and disclosures. Describing this structure to AI produces a document outline that a designer validates and refines, rather than building section by section from an empty canvas.
Practical Prompt Patterns for Common Financial Report Types
The quality of AI output in financial report design depends significantly on how specifically the design intent is described. Vague prompts produce vague starting points. Structured prompts that specify the document type, the table structure, the number format requirements, and the key design conventions produce output that requires minimal revision.
The following prompt patterns illustrate the level of specificity that works well for financial templates.
For a comparative P&L statement:
"Create a three-period comparative P&L table. Columns: current quarter (Q1 2026), prior quarter (Q4 2025), and year-over-year variance in both absolute and percentage terms. Row hierarchy: Net Revenue at the top level; Cost of Revenue and Gross Profit as first-level items; Operating Expenses as a section header with sub-items (Salaries, Marketing, G&A, R&D) indented one level below; Operating Income, EBITDA, and Net Income as summary rows at the bottom. Apply decimal alignment on all numeric columns with two decimal places. Subtotal rows in bold. Use a light grey background for the section header rows (Operating Expenses)."
For a client portfolio summary page:
"Design a single-page portfolio summary for a wealth management client statement. Top section: key metrics in a 4-column summary band — Total Portfolio Value, Period Return (%), Benchmark Return (%), and Income Received. Centre section: asset allocation table with columns for Asset Class, Market Value, Weight (%), Period Return (%), and Contribution to Return (%). Bottom section: a single disclosure paragraph in 8pt text with 12px top margin, left-aligned, using the style class 'disclosure-footer'."
For a balance sheet layout:
"Create a classified balance sheet layout. Left column: Assets, divided into Current Assets (Cash, Accounts Receivable, Inventory, Other Current Assets, Total Current Assets) and Non-Current Assets (Property and Equipment net of depreciation, Intangible Assets, Other Non-Current Assets, Total Non-Current Assets), followed by Total Assets. Right column: Liabilities and Equity, divided into Current Liabilities, Non-Current Liabilities, Total Liabilities, then Shareholder Equity components and Total Equity, followed by Total Liabilities and Equity. Ensure Total Assets and Total Liabilities and Equity rows are visually emphasised with a top border and bold text. Number format: n;0 (no decimals, comma thousands separator)."
These prompts share a structural property: they specify the hierarchy explicitly, describe the formatting requirements directly, and leave nothing ambiguous about what the table should contain. The AI produces the structure; the designer validates it and connects the data.
Where Humans Must Stay in Control
The speed benefit of AI-assisted financial report design is real. So is the risk of treating AI output as a finished deliverable rather than a starting point. Three areas require human authority that cannot be delegated to the AI assistant.
Data binding accuracy. AI designs the structure of a financial template. It does not connect that structure to your data. The table showing "Total Portfolio Value" in the correct position with the correct formatting still needs to be bound to the field in your data source that contains the correct value. This sounds obvious, but the speed of AI template generation can create false confidence: a report that looks correct structurally and visually may have data bindings that are incorrect, incomplete, or pointing to the wrong field. Verifying data binding is a deliberate step that must happen after AI generates the structure, before the template goes anywhere near production.
Regulatory format compliance. The structural accuracy of a financial report is not the same as its regulatory compliance. A P&L structured correctly according to common practice may still not meet the specific format required by your regulatory body, your jurisdiction's accounting standards, or your client's mandate specifications. AI generates patterns based on common conventions; it does not know which specific regulatory format applies to your report or your client. This verification is the designer's responsibility, done against the specific requirements that govern each document type.
Sign-off before client distribution. Any financial document that reaches a client, regulator, or counterparty should have a named approver who has reviewed the template output against real data before distribution is enabled. This is not a bureaucratic requirement. It is the step that catches the decimal-point error, the missing disclosure, the incorrect benchmark reference, or the binding that pulls the wrong period's data. AI-generated templates make it faster to reach this review step. They do not eliminate its necessity.
How This Works in CxReports
CxReports' AI assistant operates directly inside the report editor, interpreting natural language prompts and executing the corresponding changes in the template. For financial report design, this means the workflow described above — describe, review, refine — runs inside the same tool used for data binding, scheduling, and delivery configuration.
Structured financial tables from prompts. Describing a P&L hierarchy, a balance sheet structure, or a portfolio allocation table in a prompt produces a working starting point in the editor. The AI creates the table with the described row and column structure, applies the specified hierarchy (bold headings, indented sub-items, subtotal rows), and configures the number formats specified. The designer's first task after AI generation is connecting the data and verifying the structure, not building it.
Consistent number and date formatting. CxReports' text format system supports the full range of financial formatting requirements: decimal-aligned numbers with configurable precision (n;2 for two decimal places, n;0 for whole numbers), currency formatting with ISO currency codes (currency;EUR;0;2), percentage formats (p;2), and accounting format for negative numbers. Instructing the AI to apply a specific format across all numeric columns in a template executes this consistently — the designer verifies the result rather than configuring each column manually.
Header and footer disclosures. Templates in CxReports define shared headers and footers across all pages of a given page type. Disclosure text, regulatory registrations, and boilerplate notices configured in the template footer appear consistently across every page that uses that template. The AI can be instructed to add, position, and style these elements; the compliance team reviews the text content independently. Updates to disclosure text in the template propagate to every report that uses it — a single change, not a per-report edit task.
Theme-driven visual consistency across document families. A theme in CxReports carries the visual definition shared across all templates in a workspace: typography, colour palette, table styling, and heading formats. Defining a financial document theme — font family, heading colour hierarchy, table header background, number column alignment — and applying it across all report types in the workspace ensures that P&L statements, balance sheets, portfolio summaries, and client statements share a consistent visual identity without manual synchronisation.
Getting Started with CxReports
| Financial design requirement | CxReports mechanism | AI-assisted approach |
|---|---|---|
| Structured financial tables (P&L, balance sheet, portfolio) | Report editor — tables with configurable hierarchy and styling | Describe structure in prompt including row hierarchy, column definitions, subtotal positions |
| Decimal precision and number alignment | Text formats (n;2, currency;EUR;0;2, p;2, n;0;2;a) |
Specify format codes in the prompt; AI applies across all relevant columns |
| Consistent header/footer disclosures | Template page headers and footers (shared across all pages of that type) | Prompt AI to add disclosure block with specified position, typography, and style class |
| Visual consistency across document family | Themes (applied to all templates in workspace) | Define financial theme once; AI applies it when designing new report types in the workspace |
| Repeating boilerplate across pages | Template-level elements (logo, page numbers, footer text) | Describe the repeating element once; AI places and styles it in the template definition |
| Data binding to financial data sources | Data sources (SQL, API, JSON) + report parameters | Human step — connect structured fields after AI generates the table layout |
For documentation on the report editor, text formats, templates, and themes, see the CxReports documentation. To see the AI assistant applied to your specific financial report types, book a demo.