The reporting request backlog is not a capacity problem. It is a translation problem.
Every organisation that runs a reporting function has a version of the same situation. Business teams — operations, finance, HR, commercial — know exactly what they need: specific data, in a specific layout, delivered on a specific schedule. Designers and developers can build it. But between "I need a report showing X" and "here is the report showing X" lies a translation process that can take weeks.
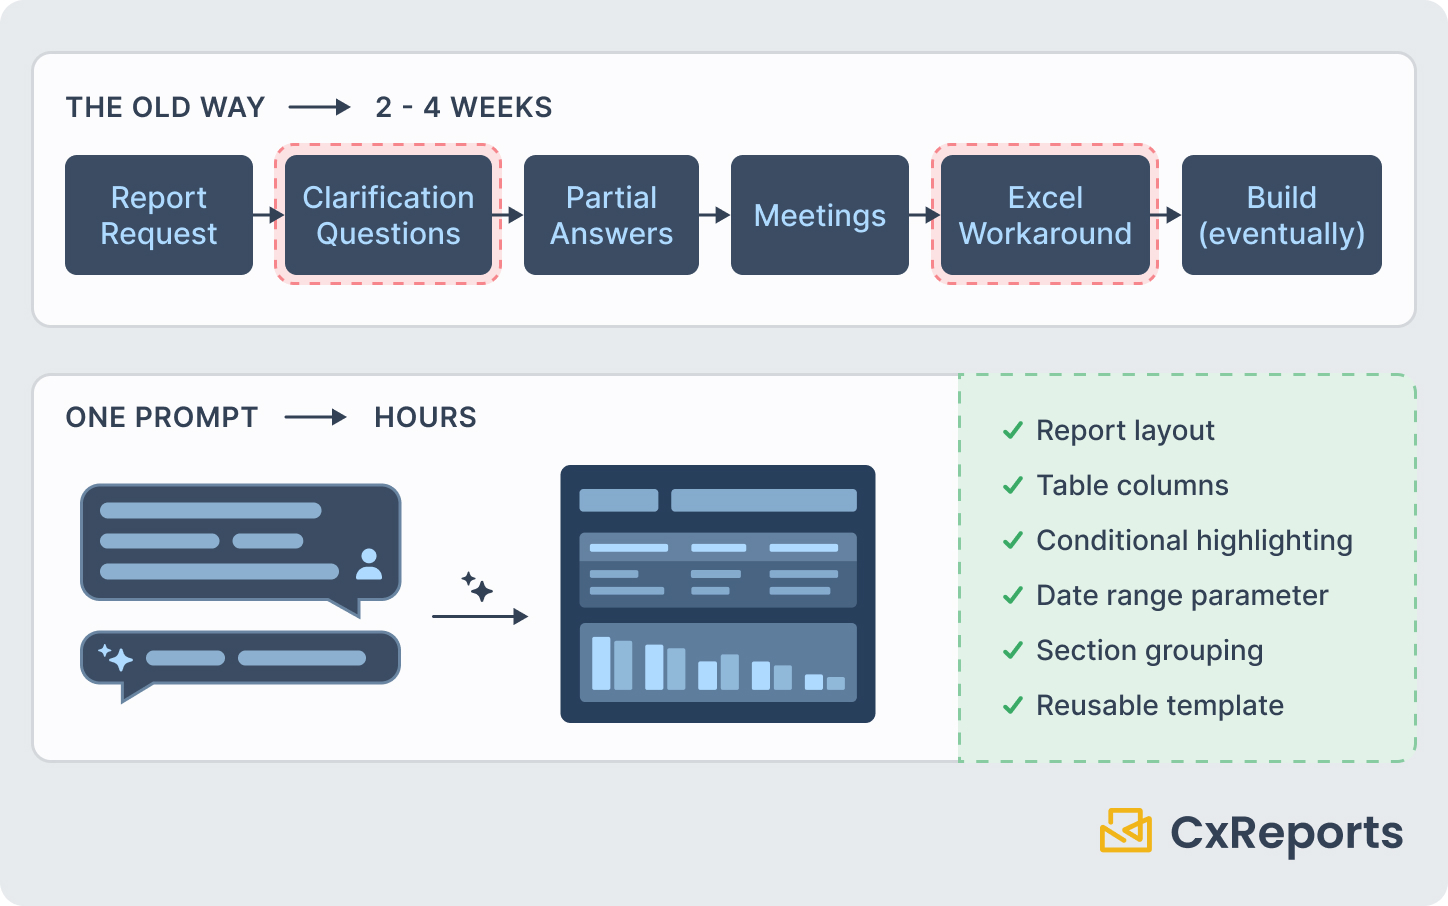
The translation process is not the building. It is the back-and-forth: which data source? which date field? what does "by region" mean — geographic region or business unit? portrait or landscape? how many rows typically in the table? The specification conversation before any building starts can take as long as the building itself.
When that translation gap closes — when the person who knows what they need can describe it directly and get a working starting point — the queue starts to move differently.
Where the Time Actually Goes
It is worth being specific about the traditional reporting request lifecycle, because the bottleneck is not always where it appears to be.
A business analyst submits a report request: a weekly summary of order processing times, by region, with exceptions highlighted. Simple brief. One page. Clear purpose.
The designer or developer responds: what are the database tables involved? What is the field name for processing time? Is "exception" defined in the data or does it need to be calculated? What is the date range — rolling 7 days from today, or the previous calendar week? Should the report be emailed automatically or available on demand?
These are all legitimate questions. Answering them requires the business analyst to look things up, consult with colleagues, or admit they do not know all the specifics. A two-day turnaround becomes a two-week thread.
The analyst, who cannot wait two weeks for an urgent operational view, exports the data to Excel and builds a manual version. This manual version then persists — it is rebuilt every week, manually, because the "proper" report has not arrived yet, or because the manual version evolved to include additional columns that the official request did not.
By the time the proper report is built and delivered, the analyst may be more invested in their Excel version than in learning a new system.
What Changes When the Business Team Can Describe Directly
An AI assistant that operates inside the report editor changes the starting position of the request process. The business team member does not need to write a specification. They describe the report — what it should show, how it should be structured, what it is for — in plain language. The AI interprets that description and builds a working starting point.
This is not report generation in the sense of "paste data into a template and download a PDF." It is template creation: the AI builds the report design itself — the layout, the sections, the table structure, the parameters — as a reusable template that then generates PDFs on demand with live data.
The difference matters because it addresses the right problem. Generating a one-time export from data is already solvable with a dozen tools. What is hard is creating a report that runs reliably, consistently, against live data, for the right audience, in the right format, every time it is needed. That is what a template does. And that is what the AI assistant produces a starting point for.
The business team member who writes "weekly operations summary — orders processed, average processing time, exceptions flagged, by region, table format, one page, date range as a selectable parameter" gets back a structured template with a table, section headers, and a date range parameter. They review it: does this look right? The structure looks right. The data connections need to be verified — is it actually reading from the right database table? That step still requires coordination with someone who knows the data.
But the starting point is there. The structure exists. The designer who previously would have spent a morning building this from scratch is now reviewing a draft and making adjustments — a 20-minute task instead of a three-hour one.
A Realistic Workflow
Here is what the process actually looks like for a business team that has access to the AI assistant in CxReports:
1. The business team member opens the report editor and describes the report. "Monthly finance summary — total revenue by product category, comparison to last month, table with percentage change column, one page, portrait."
2. The AI assistant builds a starting point. A one-page template appears: a table with category, current month, prior month, and change columns. Section headers. Parameter for the report month. The visual structure is correct.
3. The business team member reviews the structure and flags what needs adjustment. The table looks right. The column headers need renaming to match the organisation's terminology. The percentage change column should highlight negative values in red.
4. The business team member makes prompt-based refinements. "Rename the column headers to match our standard naming: Revenue, Prior Month, Change." "Highlight rows where the Change column is negative in a light red background."
5. The data binding is verified. Either the business team member maps the template to the correct data source themselves (if they have the access and knowledge to do so), or they hand this specific step to someone with data system access. This is the one step that reliably requires technical knowledge — knowing which database fields correspond to which columns.
6. The template goes through a brand review. If the organisation has a report design standard, a designer spends a few minutes confirming the template meets it before it is promoted to production. This is faster than a full design handoff because the structure and content are already in place.
7. The report is in production. It runs on schedule, delivers to the right recipients, and generates a consistent PDF every time.
The total elapsed time from description to production: hours, not weeks. The designer's contribution: a brand review, not a full build. The business team's contribution: the description, the structure review, and coordination on data binding.
What the Business Team Still Cannot Skip
Being direct about this matters, because the value of AI-assisted design breaks down if the guardrails are ignored.
Data binding verification. The AI builds the template structure but does not know which database tables and fields exist in your system. Connecting the template to the right data requires someone who knows the data model. For teams with direct data access and some SQL familiarity, this is straightforward. For teams without that access, this step requires a brief handoff to someone who does.
Brand and production review. Reports that go to external recipients — clients, regulators, partners — need to look correct. If the organisation has a reporting design standard, a designer should confirm the template meets it before it goes live. For internal-only reports with relaxed brand requirements, this review can be lighter, but it should still happen.
Sensitive and regulated data. Reports that contain financial data subject to regulatory requirements, or that include personal data about clients or employees, need appropriate review regardless of how the template was built. The method of construction does not change the compliance requirements of the output.
What This Means for How Reporting Teams Work
The practical shift when business teams can produce first drafts is not that designers become redundant. It is that the designer's queue changes composition.
Currently, a meaningful portion of design requests are straightforward: standard layouts, common structures, clear briefs that could have been specified completely without a designer involved. These requests occupy designer time that is better spent on complex, high-judgment work — reports with unusual structures, non-standard data integrations, client-facing documents that require careful brand attention.
When business teams produce drafts of their own standard reports, those simple requests stop arriving as build tickets. They arrive as review requests — which take a fraction of the time and allow the designer to maintain the quality standard without owning the construction.
The organisation gets more reports, faster. The designer gets more interesting work. The business team gets fewer weeks waiting in the queue.
Getting Started
| What the business team provides | What the AI assistant produces |
|---|---|
| Plain-language description of the report | Structured template with layout and sections |
| Column names and formatting preferences | Table with correct columns and parameter fields |
| Refinements via follow-up prompts | Adjustments applied directly in the template |
| Data source access (or liaison with someone who has it) | Connected template ready for production review |
Documentation:
To see how business teams can move from description to production-ready report, book a demo with the CxReports team.