Every AI tool vendor claims to save time. The more useful question is: save time on what, by how much, and how would you know if it did?
For CTOs and operations leaders evaluating AI-assisted report design, vague productivity claims are not a useful basis for a decision. What is useful is a measurement framework — a way to establish a baseline before adoption, track the right metrics after, and distinguish genuine improvement from the optimism that surrounds any new capability.
This post breaks down where report design time actually goes, which portions are genuinely accelerated by AI, what realistic improvement looks like, and how to build a credible business case before committing.
Where Report Design Time Actually Goes
The first step in measuring impact is knowing what you are measuring. Report design time is not monolithic — it breaks down into distinct categories with different characteristics and different susceptibility to AI acceleration.
First creation. Building a new template from scratch: defining the page structure, placing and configuring elements, applying styling, setting up data sources, creating parameters. This is typically what people think of as "report design time." It is significant, but it is often not the largest category over the life of a template.
Iteration cycles. Every template goes through revision rounds after stakeholder review. The stakeholder sees the first draft and requests changes — column renamed, chart moved, disclosure text updated, header colour adjusted. Each cycle requires re-entering the editor and making the changes manually. A medium-complexity report commonly goes through three to five revision cycles before production approval.
Maintenance. Live templates need ongoing maintenance: database schema changes that break queries, brand refreshes that require restyling, regulatory updates that change disclosure text, new data requirements that add sections. Maintenance is recurring and unpredictable.
Support and debugging. Templates that work in test fail in production with edge-case data. A column that wraps correctly with typical values breaks with an unusually long string. A table that paginates correctly with 20 rows does not paginate correctly with 120 rows. Tracking down and fixing these issues takes time that is rarely accounted for in initial estimates.
Variant creation. Once a successful template exists, the request for a "slightly different version" follows. Same structure, different branding for a different business unit. Same layout, different parameters for a different region. Without AI assistance, each variant starts from scratch or from a manual copy that gradually drifts from the original.
The critical insight: first creation is only a fraction of the total design time over a template's life. AI that only helped with first drafts would still be valuable. AI that also accelerates iteration and variant creation — the two categories that compound across every active template — provides substantially more value.
Where AI Acceleration Is Real — and Where It Is Not
Being specific about which categories are genuinely accelerated is important for accurate measurement. Overstating the benefit leads to disappointment; understating it leads to underinvestment.
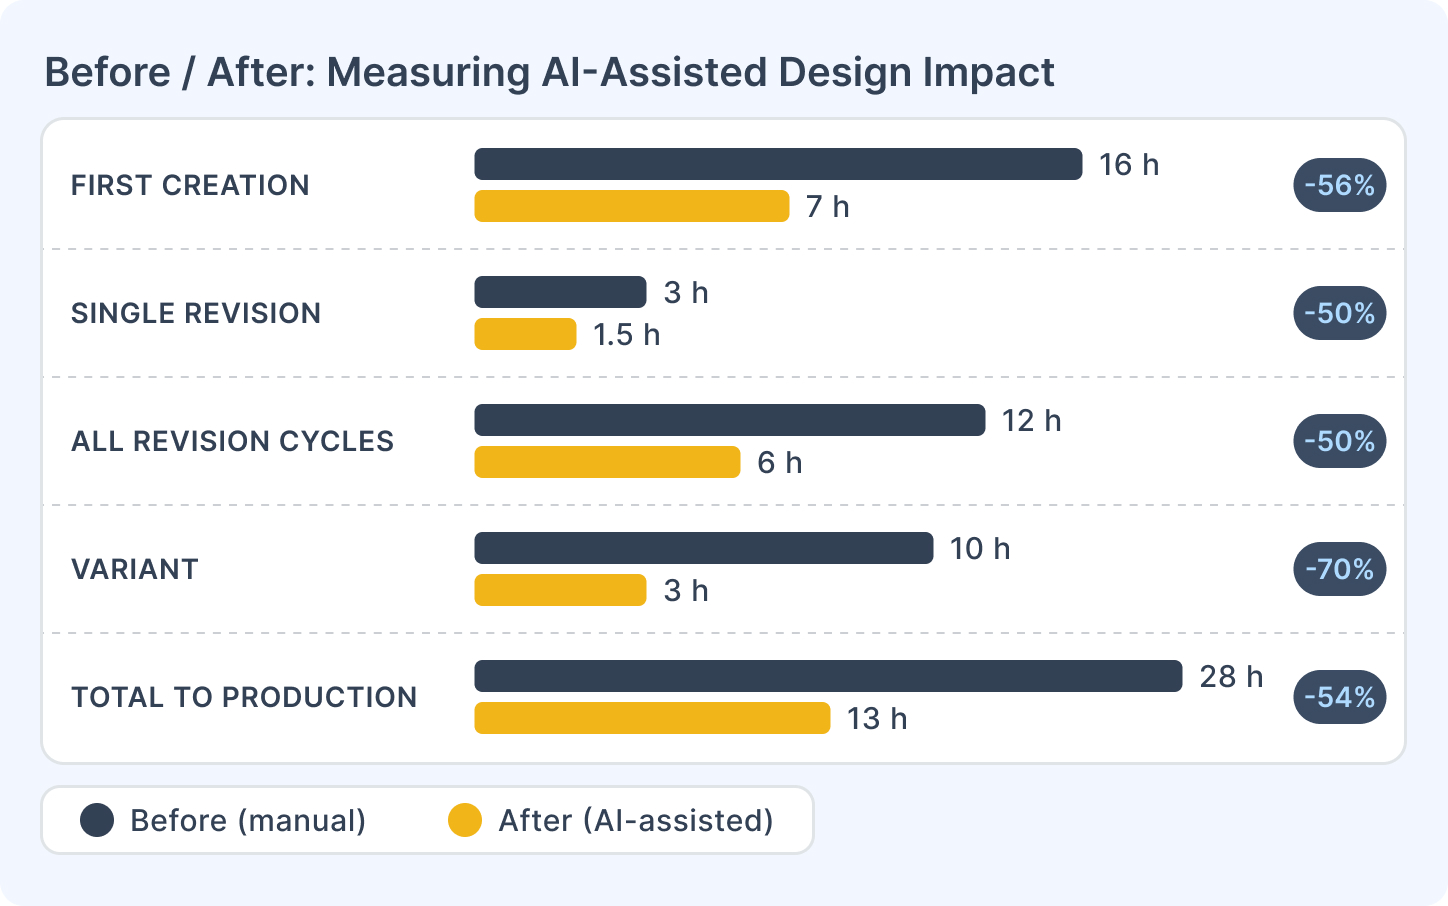
First creation: significant acceleration. Generating a structural starting point from a description — pages, element layout, initial styling — is the category most directly accelerated. A template that previously took a full day to build from scratch reaches a reviewable first draft in a fraction of that time. The construction step is replaced by a description-and-review step. Realistic reduction in first-draft time: 40–60% for medium-complexity templates.
Iteration cycles: meaningful acceleration. Changes via prompt — "rename this column", "move the chart below the table", "apply the section header style to all group headers" — are faster than manual adjustments in the editor. Not every change is describable in a single prompt, but the majority of routine revision requests are. Realistic reduction in time per revision cycle: 30–50%.
Variant creation: high acceleration. The library-scale implications of variant creation at pace are covered in Scaling Your Report Library with AI. Describing a variant of an existing template and having the AI generate a starting point based on that description avoids rebuilding from scratch. This is where the compounding effect is largest — every additional variant that gets created costs less.
Maintenance: moderate acceleration. Some maintenance tasks (restyling, structural adjustments) benefit from AI assistance. Others — particularly fixing broken data queries after a schema change — do not; those require understanding the data model and the query logic, which AI does not own.
Support and debugging: limited direct acceleration. Diagnosing edge case failures requires testing with real data and understanding what went wrong. AI does not accelerate this directly. Where it helps indirectly: AI-generated templates that include standard structural patterns are less likely to have certain categories of errors, because those patterns handle common edge cases correctly by default.
Data binding and production review: not accelerated. Verifying that the right data is connected to the right template elements is a human task regardless of how the template was built. Brand sign-off and compliance review are not affected by AI. These time costs remain constant.
Error Reduction: The Less-Visible Benefit
Time saved is the visible benefit. Error reduction is the less-visible one — and in many organisations, it is more valuable.
The categories of error that AI-assisted design reduces:
Styling inconsistency. When styles are applied manually across many elements, drift accumulates. A section header has 14px type on page 2 and 13px on page 4. A table border is 1px on the summary section and 2px in the detail section. These inconsistencies are hard to spot in the editor and embarrassing in production. AI applies styling consistently across all instances of an element type because it is operating from a single instruction, not from dozens of individual manual actions.
Missing standard elements. Templates built under time pressure often omit elements that should be there: page numbers not configured correctly, a parameter that should exist but does not, a section that handles the zero-results case. AI-generated starting points that follow standard patterns prompt a more structured review — and during that review, the missing elements are more likely to be caught.
Miscommunication between brief and build. When a business team describes a report and a designer builds their interpretation of it, there is an interpretation gap. The designer builds what they understood. The business team sees the output and corrects it. AI interprets the description more literally and produces something closer to what was described — which means mismatches surface at the review stage, not after hours of build work.
Important caveat: AI-assisted design does not eliminate errors. It shifts some error categories (inconsistency, miscommunication) while potentially introducing others (misinterpreted intent, wrong element type for the task). Net error reduction depends on the quality of the review process. Teams that review AI-generated templates carefully will see quality improvement; teams that treat "AI generated it" as a substitute for review will see new failure modes.
A Measurement Framework
The way to build a credible before/after case is to run a baseline measurement before adoption, then measure the same metrics after.
Baseline measurement (4–6 weeks before adoption):
For every report design task completed during the measurement period, log:
- Task type: first creation, revision, maintenance, variant, or debugging
- Template complexity: simple (1–2 pages, basic data), medium (3–8 pages, parameters), complex (9+ pages, multiple data sources, subreports)
- Time from task start to first reviewable draft
- Number of revision cycles before production approval
- Time per revision cycle
- Total time from first design action to production promotion
This does not need to be elaborate. A shared spreadsheet with one row per task, filled in at the end of each working session, is sufficient.
Post-adoption measurement (same 4–6 week window after adoption):
Same metrics. The comparison should show:
- First-draft time: should decrease for most template types
- Revision cycle time: should decrease for prompt-addressable change types
- Total time to production: should decrease, though the magnitude depends on how much of the current elapsed time is review and approval rather than design work
What to watch for:
- If total time does not decrease despite faster first drafts, the bottleneck may be in the review and approval process, not the design work. AI surfaces the approval bottleneck by removing the design bottleneck.
- Variant creation and maintenance benefits compound over time — a 4–6 week window may understate the long-term impact if few variants or maintenance tasks fall within the measurement period.
Building the Business Case
Once baseline data exists, the business case follows a straightforward structure:
Step 1: Quantify the AI-accelerable portion. From your baseline log, identify the tasks and time categories that AI directly addresses: first creation, revision cycles, variant creation. Sum those hours across the measurement period and annualise.
Step 2: Apply a conservative reduction estimate. Rather than assuming maximum acceleration, apply a conservative multiplier: 40% reduction in first-draft time, 35% reduction in revision cycle time. These are defensible estimates based on the category analysis above.
Step 3: Translate to cost. Multiply the reduced hours by the burdened cost of the designer's time (salary plus overhead, typically 1.25–1.5× salary). This gives an annual cost saving from efficiency.
Step 4: Add the throughput benefit. Time saved is not always directly monetisable — designers may use freed capacity to service more requests rather than reduce headcount. Quantify this as "equivalent additional capacity": if the team saves 400 designer-hours per year, that is roughly 10 additional weeks of design capacity without additional hiring.
Step 5: Compare to the cost of adoption. The cost of adopting AI-assisted design is primarily the time investment in onboarding and workflow adjustment — not typically a large separate licence cost. The payback period for most teams is measured in weeks, not months.
Getting Started
| What to measure | How to capture it |
|---|---|
| First-draft time per template type | Log at task start and completion |
| Revision cycles per template | Count before production promotion |
| Time per revision cycle | Log per cycle |
| Variant creation time | Compare to comparable first creation |
| Total time to production approval | Start of design to production date |
Documentation:
If you want to run a structured pilot to establish baseline and post-adoption metrics, talk to the CxReports team — we can help design the measurement approach for your specific template portfolio.