

"No-code reporting" does not mean the same thing in every context where vendors use it. In some tools it means no code to run a pre-built report. In others it means no code to design the visual layout. In others it means no code to connect a data source using a form-based wizard. In marketing copy, it often means all three simultaneously, for every kind of user, with no caveats.
The practical question for a business analyst, operations manager, or CTO evaluating a reporting tool is not whether it is "no-code." It is: which steps require which kind of knowledge, and which people in my organisation can perform which steps independently.
The answer to that question has genuinely changed in 2025. AI-assisted report design has lowered the technical threshold for the design and layout phase of report building substantially. What took specialised editor knowledge and CSS fluency can now be described in plain language and executed by the AI. This is real.
What has not changed is the technical foundation the design sits on. Data source connections, production deployment, access control configuration, and integration into workflow systems still require technical knowledge. These requirements have not been eliminated by AI. They have been unchanged by it.
The honest picture is a division of labour that AI has meaningfully rebalanced - not eliminated.
What "No-Code" Actually Means in Reporting Tools
"No-code" is applied to reporting tools in at least three distinct senses, and conflating them creates expectations that the tool cannot meet.
No code to run reports. The most common meaning. Business users can open a reporting tool, select a report, set parameters (date range, region, account), and generate a PDF or download a file without writing code. This has been true of most reporting tools for decades. It is an accurate claim, but it says nothing about who can build or modify the reports.
No code to design report layouts. A meaningfully different claim. This is the territory that AI-assisted design has changed. A user who can describe what they want in words - "I need a table with these columns, a chart below it showing trends, and the company logo in the top right" - and have the AI generate a working starting point has access to the design layer without operating a complex editor. This is new and significant in 2025.
No code to connect data sources. A claim that is frequently made but rarely accurate for complex data. Simple integrations - a pre-connected database, a well-structured API with a form-based wizard - can genuinely be configured by a non-developer. Complex integrations - parameterised stored procedures, multi-table joins for a specific report scope, REST APIs requiring authentication handling - require someone who understands data modelling and SQL or API design.
When a vendor says their tool is "no-code," the natural question is: which of these three, and for whom? A tool that is no-code for running and distributing pre-built reports is very different from a tool that is no-code for the full workflow from data source to delivered PDF.
What Non-Technical Users Can Genuinely Do in 2025
The honest answer to this question is: more than before, and specifically more in the design and layout phase.
Describe and iterate on visual layouts. A business analyst who knows what a report should look like can describe it to an AI assistant and produce a working starting point without building it manually in a visual editor. "A cover page with our logo and the client name, then a summary table showing portfolio value and return, then a breakdown by asset class" is an instruction that the AI can translate into a document structure. The analyst's role shifts from construction to review - evaluating what the AI produced and describing corrections.
Produce first drafts that previously required a specialist. A medium-complexity report that would previously have taken a specialist report designer half a day to build from scratch can reach a reviewable first draft in under an hour through AI-assisted description and iteration. This does not mean the analyst does everything the designer did - data binding and testing still require different skills - but the design iteration phase is genuinely accessible.
Apply styling and visual changes through description. "Make all the section headers bold with a grey background" or "change the chart to a bar chart and move it above the table" are instructions a non-technical user can give and verify. The AI executes them; the user confirms the result is what they intended. This is a real change in who can participate in report refinement.
Create variants of approved templates. Once a base template is built and approved, describing a variant - "the same layout but with an extra disclosure section for Singapore and the regional contact details on the cover page" - is something a business analyst can do with AI assistance, without rebuilding from scratch. Switching the report to a regional theme or a different header and footer template is a setting the designer changes, not something the assistant does.
What these capabilities share is that they are in the design and visual layer - the layer that AI has genuinely lowered the barrier to enter.
Where Technical Involvement Remains Necessary
Three areas of the reporting workflow have not changed, and are not expected to change, regardless of how capable AI-assisted design becomes.
Data source connections and query authorship
Reports display data. Where that data comes from, how it is queried, and how it is filtered for the right scope requires someone who understands the data model.
Connecting to a SQL database requires knowing which tables hold the relevant data, writing a query that retrieves the right rows and columns with the right filters, and handling edge cases: what happens when a required value is null, how are date ranges applied, are there business rules that govern which records should be included.
API data sources require understanding the API's endpoint structure, authentication mechanism, pagination behaviour, and response format. A business analyst can often understand what data an API provides; configuring the integration correctly requires technical familiarity with how APIs work.
JavaScript-based data sources and computed data transformations - combining results from multiple sources, applying calculations in the data layer - require programming knowledge.
AI cannot substitute for understanding the data model. It can help structure a query once the analyst describes what data they need (in CxReports, the assistant can browse connected databases, create the data source, and read the rows it returns), but the analyst needs to know enough to verify that the query is correct and that the results it returns are the right ones. Deploying a report whose data binding has not been verified by someone with data knowledge is the origin of most reporting errors.
Access control and workspace configuration
Who can generate which reports, which workspaces contain which report families, how user accounts are provisioned and deprovisioned, which credentials are used for data source connections, and which AI provider and API key the AI assistant uses - these are administrative and security decisions that require IT involvement.
Access control is not a design problem. It is a governance problem, and its consequences when misconfigured (a user generating a report for an account scope they are not authorised to see, or a shared login that makes audit trails unusable) are operational and compliance failures. This configuration layer is, and should remain, an IT function.
Production deployment and integration
Getting a report from a designed template to an automated workflow that generates and delivers it at the right time to the right recipients requires integration work. Scheduling jobs, configuring delivery recipients from a data source, setting up API-triggered generation in an upstream system, managing credentials securely, and monitoring production runs for failures - these are operations and engineering responsibilities.
A business analyst who has designed an excellent template has produced something that the operations and engineering team needs to deploy. That handoff is not removed by AI assistance in the design phase.
The Realistic Division of Labour
The most useful way to frame AI-assisted reporting for a team considering adoption is not "who can use it without technical help" but "how does the work get divided, and how has that division changed."
Before AI-assisted design:
- Business analyst or operations manager: defines requirements, provides data, reviews finished reports, requests changes
- Report designer (specialist): builds templates from scratch, implements revisions, manages the editor
- IT/admin: data source connections, access control, deployment, monitoring
With AI-assisted design in 2025:
- Business analyst or operations manager: defines requirements, describes and iterates on the design directly with AI assistance, reviews AI-generated output, approves before handoff
- Report designer (specialist): focuses on complex templates, data binding verification, edge-case handling, production approval - less time on construction, more on governance
- IT/admin: data source connections, access control, deployment, monitoring, plus one new task: configuring the AI integration and granting the
AIpermission to the users who design
The shift is in the design layer: the business analyst is now a participant in design, not just a requirements provider. This reduces the back-and-forth between analyst and designer, compresses iteration cycles, and produces templates that are closer to the analyst's intent before the first human designer review.
It does not eliminate the designer's role. The designer's expertise becomes more focused on the parts of the process that require it - data correctness, production quality, edge cases, governance - rather than diluted across construction work that the analyst could not previously contribute to.
Setting Accurate Expectations for Rollout
When introducing AI-assisted reporting to a team that includes non-technical users, expectations set at the beginning determine whether adoption succeeds or frustrates.
Accurate expectation: AI makes the design phase accessible. Business analysts and operations managers can describe what they want and iterate visually with significantly less friction than before. This is the genuine capability. Set this expectation.
Accurate expectation: data work still needs a data person. Every report that uses live data needs someone to configure the data source correctly and verify the query output. If the analyst does not have this capability, the workflow still includes a technical handoff at the data layer. This is not a failure of the tool - it is an accurate description of the skill required.
Accurate expectation: production readiness requires a review. An AI-generated template is a starting point, not a production-ready deliverable. Before a report is used for any consequential purpose - client distribution, regulatory submission, management reporting - someone with the appropriate knowledge must review the data binding, the output format, and the correctness of the results.
Accurate expectation: IT is still involved. Access control setup, deployment, and integration are IT responsibilities. If the rollout plan assumes that business users will set up their own workspace permissions and deploy scheduled jobs, the plan has a gap. These steps require coordination with IT from the start.
Teams that set these expectations accurately find that AI-assisted reporting delivers meaningful efficiency gains in the design layer and increases analyst ownership of the reporting workflow. Teams that set expectations based on vendor "no-code" marketing find that the tool works as described - but the workflow still has technical requirements that someone needs to handle.
Where CxReports Sits on the No-Code Spectrum
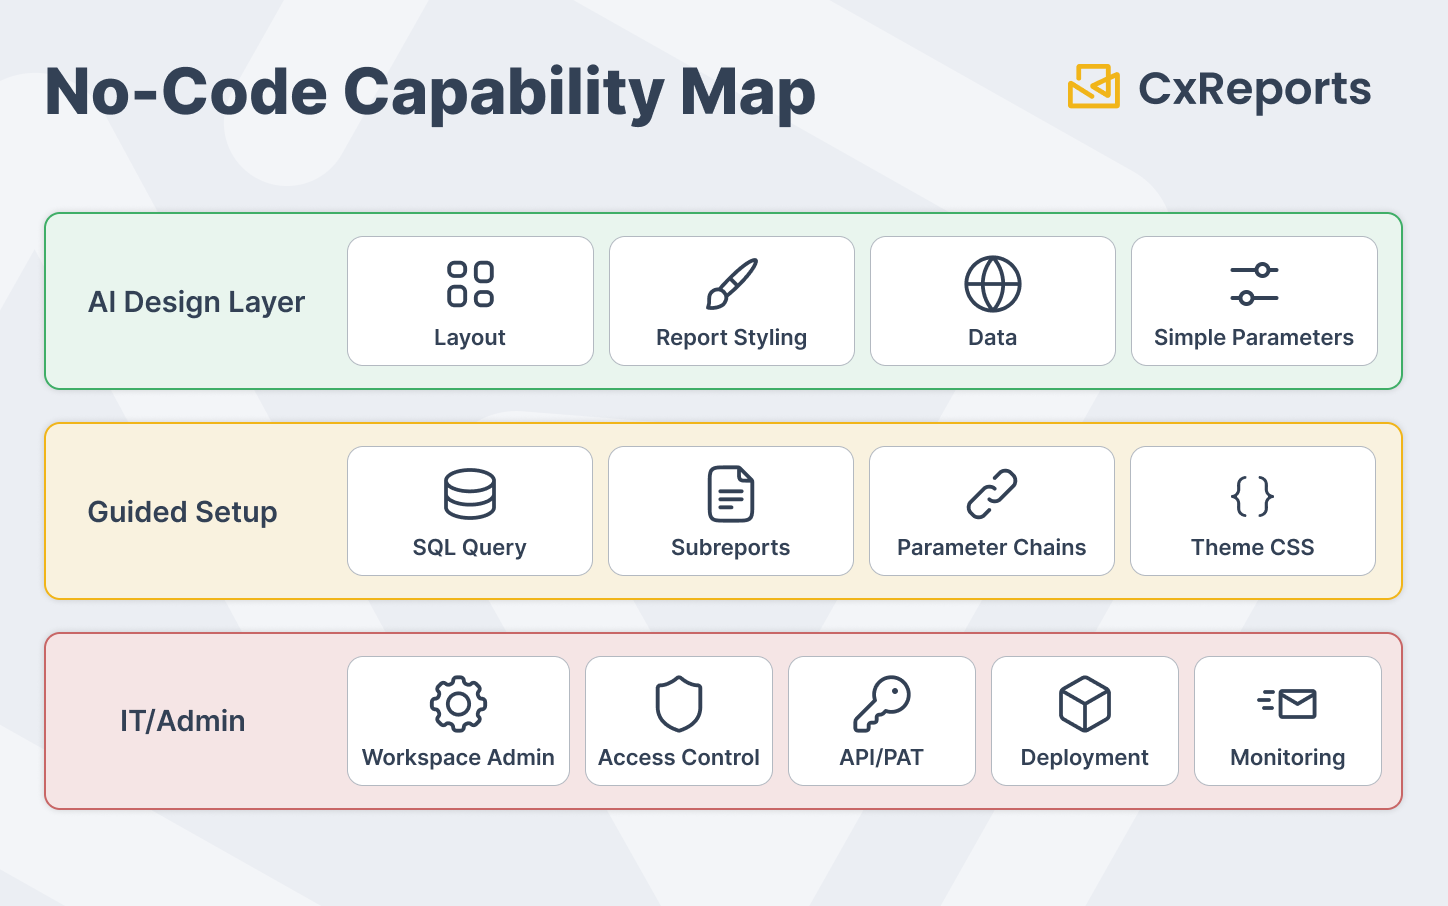
CxReports is a visual report builder with an AI assistant that lowers the technical threshold for the design and layout phase. Here is an honest map of which steps require which level of technical knowledge.
Low technical threshold with AI assistance:
- Designing report layouts: drag-and-drop editor plus AI assistant for natural language design instructions. A business analyst who can describe a report can produce a working starting point.
- Applying themes and visual styling: selecting and applying a theme requires no technical knowledge; customising theme CSS requires CSS familiarity.
- Creating and modifying parameters: adding text, number, date, and lookup parameters through the parameter configuration interface is accessible to non-technical users for simple cases.
- Translating dictionaries: the AI translation integration translates dictionary entries automatically once the source language is finalised.
Semi-technical - accessible with guidance:
- SQL data source configuration: requires writing a SQL query. With guidance on the data model, a data-literate analyst can configure simple queries; complex multi-table queries require a developer or data analyst.
- Subreport setup and parameter passing: requires understanding how parent and subreport parameters relate; accessible with documentation support for non-developers.
Technical - IT or admin function:
- Workspace creation and user provisioning: root user function requiring admin access.
- AI assistant setup: an admin configures an AI integration (OpenAI, Anthropic, Google, or DeepSeek, with your own API key) and grants the
AIrole permission. Analysts cannot use the assistant until both are done. - Role definition and access control configuration: admin function.
- PAT creation and API integration: developer function.
- Production deployment (on-premise): infrastructure and operations function.
- Scheduled job configuration for batch delivery: accessible through the UI but requires understanding of the delivery workflow and data-driven recipient configuration.
Getting Started with CxReports
| Who | What they can do with AI assistance | What still requires IT/admin involvement |
|---|---|---|
| Business analyst / operations manager | Describe and iterate on report layouts using the AI assistant; apply themes; create simple parameters; review and approve AI-generated templates | Data source connection setup; access to workspace; production deployment |
| Report designer | Build complex templates faster; produce variants; apply styling at scale | Data binding verification for complex queries; edge case testing; production sign-off |
| IT / admin | - | Workspace creation and user management; custom role definition; AI integration setup and AI permission; PAT creation for API access; scheduled job configuration; on-premise deployment |
For documentation on the AI assistant, report editor, data sources, and workspace configuration, see the CxReports documentation. To discuss how your team's skills map to the CxReports workflow, book a demo.